We’ve come a long way, baby.
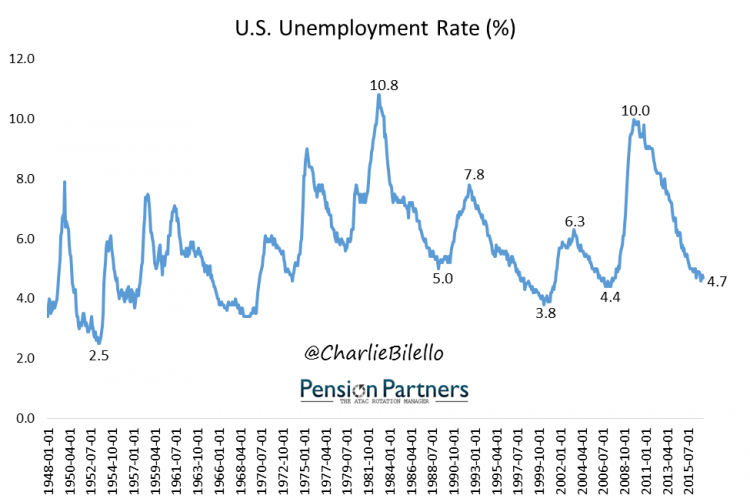
In October 2009, the U.S. Unemployment Rate stood at 10%, the highest level since the deep recession in the early 1980’s. Since then, it has moved all the way down to 4.7%.

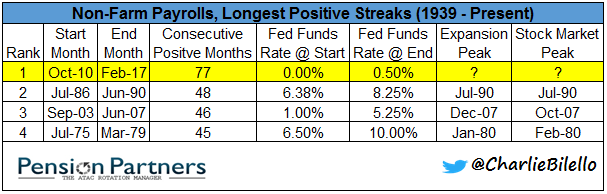
Payrolls have now expanded for 77 consecutive months, by far the longest streak in history.
With economic news improving, the pundits are out in full force declaring “this is great news for the stock market.”
Seems intuitive, but is that actually the case? There’s only one way to find out: test it.
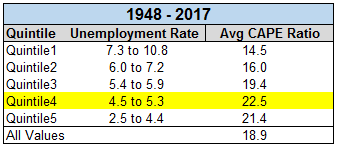
We have data on the Unemployment Rate going back to 1948. If we break down the rate into quintiles what we find is an interesting relationship with forward stock returns.
As you can see in the tables below, the highest Unemployment Rates have been followed by the strongest returns on average, and the highest probability of a positive return. Conversely, the lowest Unemployment Rates tend to be followed by below average forward returns and a lower probability of a positive return.
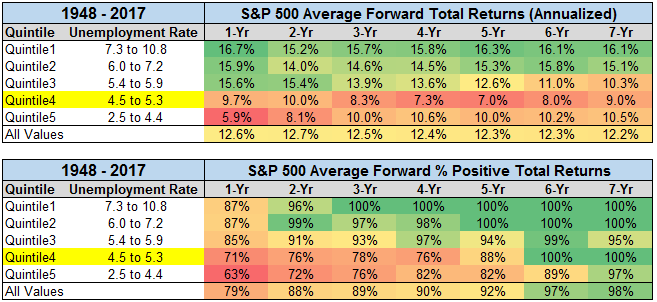
What’s driving this relationship? Valuation. On average, lower unemployment rates tend to be associated with higher valuations and vice versa.
Why? Because when there’s good news (low unemployment), people are willing to pay a higher multiple for a given level of earnings then when there’s bad news (high unemployment).
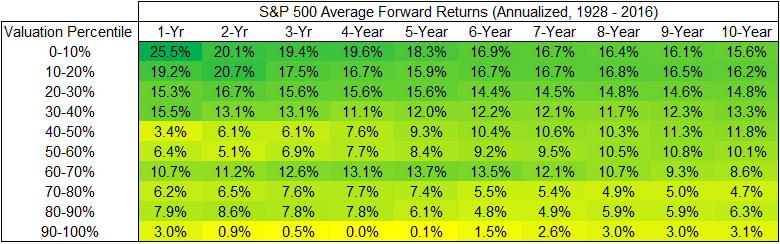
That is important because on average, the higher the valuation, the lower the forward return.
That’s not to say that stocks can’t do well following low levels of unemployment. They certainly can and have done so in the past. In fact, the all-time low in the Unemployment Rate was in 1953 (at 2.5%), after which stocks had an annualized return of 17.7% over the next 7 years. But stocks were very cheap in 1953 with a CAPE ratio of only 11.6. Today’s CAPE ratio of over 29 is not a fair comparison.