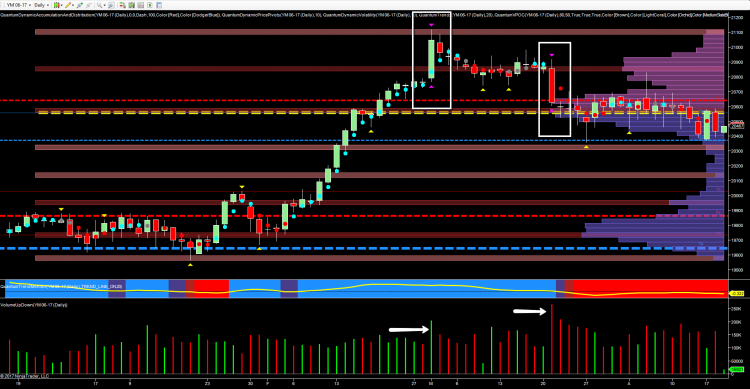

US equity markets continued to wallow again yesterday, as risk-on appetite wanes as global tensions continue to weigh on risk asset classes, bringing to a halt the strong bullish moves post Trump. The classic candle of the 1st March for the YM e-mini on the daily chart was the first potential signal of trouble ahead, with the price action closing as a wide spread up candle but confirmed as moving outside the average true range on above average volume, and signaling a warning of a potential pause and reversal. Indeed the comparative nature of the volume suggested this was a potential trap move, given the spread of the candle, and the associated volume which one would have expected to be considerably higher than is shown. This is one of the many facets of volume price analysis, and the comparative nature of price and volume is one which then helps to frame what is happening on the chart in the context of previous price action and volume relationships on the same timeframe and horizon.
Moreover, the appearance of such candles with price action outside the average true range is unusual on a slower timeframe, and as such is an important red flag signal of potential trouble ahead, particularly given the relative volume, with the market duly reversing immediately back within the spread of the candle, trapping traders into weak positions as a result. This was duly confirmed on the 21st March with an equivalent, this time to the downside, but this time on extreme volume and confirming the bearish sentiment from the big operators. Since then, we have seen volumes building on the Y axis of price, with the volume point of control, the yellow dotted line, now confirming the fulcrum of price agreement in the 20,570 area. Above this area, we have several high volume nodes presenting formidable barriers to any progress higher, with a ceiling of price resistance also confirmed in the 20,640 regions and denoted with the red dashed line on the accumulation and distribution indicator. Below, the blue dashed line is providing a platform of support currently in the 20,380 region, and this level is now key and a level which has been tested on several occasions in the last few weeks. Should this level be breached, then below we have low volume nodes through from this level to 19,870, where potential deeper support then awaits. In summary, then, this level is now key and if breached we may see a swift move lower in the medium term for US equities.