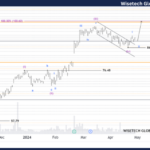
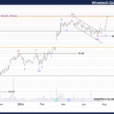
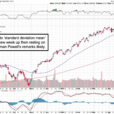
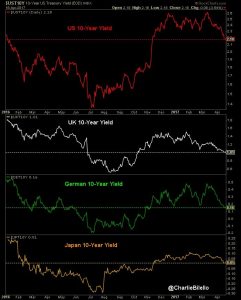
The latest movements in markets are starting to be in sync with a slow growth economy. This makes sense as the blue-chip GDP forecast has been decelerating quickly. The global trend in declining bond yields can be see below. The range the U.S. ten-year bond was in for the beginning of the year has been broken to the downside. Because yields were at record lows last summer, many investors assumed that was the bottom, but that assumption may be wrong. The bond yields had increased since the summer because an uptick of inflation due to rising oil prices, some improvement in U.S. survey data, and an increase in Chinese credit growth.
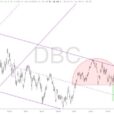
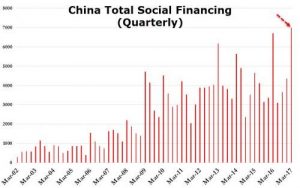
The amount of credit sloshing around in the Chinese economy has been increasing lately. Aggregate financing increased $308 billion last month. As you can see from the chart below the total Chinese social financing in Q1 was equivalent to slightly above $1 trillion. When the credit cycle reverses globally, this trend toward increasing credit in China will also fall flat.
On Tuesday, the Dow was down further than the other indices because Goldman Sachs had an uncharacteristic earnings miss. The Dow fell 0.55% while the Russell 2000 was pushed to the positive side, closing up 0.05%. Goldman Sachs beats earnings 90% of the time, but it missed EPS expectations by 16 cents causing the stock to fall 4.72%. The stock is now down almost 15% from its all-time closing high on March 1st. The banks which reported good earnings have seen their stocks fall, so it’s not surprising to see Goldman Sachs stock crater this much. Goldman underperformed the other banks partially because it is an investment bank which is different from a traditional commercial bank. One example of this is the net interest income category where Bank of America had a 5% increase year over year while Goldman Sachs had a 42% decrease.
One of the reasons bank stocks have declined besides the recent pull back in rate hike estimates due to weak economic reports and the pause in hikes when the balance sheet starts to unwind is the uptick in delinquencies. While the recovery has been lumpy, the rate of year over year delinquency declines has steadily fallen. The deceleration has led to delinquencies starting to increase again like they did in the previous two cycles. Be careful in reviewing the chart below because the left-hand scale is inverted to show the correlation between the S&P 500’s year over year returns and the average 30-day delinquencies of major credit providers.