Archives by Month:
- May 2024
- April 2024
- March 2024
- January 2024
- December 2023
- November 2023
- October 2023
- August 2023
- July 2023
- June 2023
- May 2023
- February 2023
- January 2023
- December 2022
- November 2022
- October 2022
- September 2022
- August 2022
- July 2022
- June 2022
- May 2022
- April 2022
- March 2022
- February 2022
- January 2022
- December 2021
- November 2021
- October 2021
- September 2021
- August 2021
- July 2021
- June 2021
- May 2021
- April 2021
- March 2021
- February 2021
- January 2021
- December 2020
- November 2020
- October 2020
- September 2020
- August 2020
- July 2020
- June 2020
- May 2020
- April 2020
- March 2020
- February 2020
- January 2020
- December 2019
- December 2018
- November 2018
- October 2018
- September 2018
- August 2018
- July 2018
- June 2018
- May 2018
- April 2018
- March 2018
- February 2018
- January 2018
- December 2017
- November 2017
- October 2017
- September 2017
- August 2017
- July 2017
- June 2017
- May 2017
- April 2017
- March 2017
- February 2017
- January 2017
- December 2016
- November 2016
- October 2016
- September 2016
- July 2016
- June 2016
- April 2016
- March 2016
- February 2016
- January 2016
- December 2015
- November 2015
- October 2015
- September 2015
- August 2015
- July 2015
- June 2015
- May 2015
- April 2015
- March 2015
- February 2015
- January 2015
- December 2014
- November 2014
- October 2014
- September 2014
- August 2014
- July 2014
- June 2014
- May 2014
- April 2014
- March 2014
- February 2014
- January 2014
- December 2013
- November 2013
- October 2013
- September 2013
- August 2013
- July 2013
- June 2013
- May 2013
- April 2013
- March 2013
- February 2013
- January 2013
- November 2012
- October 2012
- August 2012
- July 2012
- June 2012
- May 2012
- April 2012
- March 2012
- February 2012
- January 2012
- December 2011
- November 2011
- October 2011
- September 2011
- August 2011
- July 2011
- June 2011
- May 2011
- April 2011
- March 2011
- February 2011
- January 2011
- December 2010
- November 2010
- October 2010
- September 2010
- August 2010
- July 2010
- June 2010
- May 2010
- April 2010
- March 2010
- February 2010
- January 2010
- December 2009
- November 2009
- October 2009
- September 2009
- August 2009
- June 2009
- April 2009
- February 2009
- December 2008
- November 2008
- October 2008
- August 2008
- June 2008
- May 2008
Archives by Year:
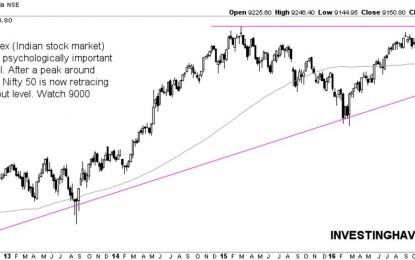
India Stock Market About To Test Bull Market Breakout
The stock market in India is our favorite market, and we expressed that many times in the last 18 months. Our India stock market outlook for 2017 is coming to pass. Recently, we made another bullish call on the Indian stock market right at a time it was ready to challenge all-time highs. Things evolved faster than we anticipated, as the India […]
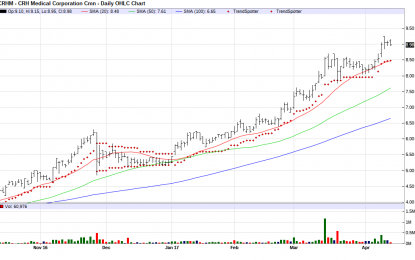
CRH Medical Corporation – Chart Of The Day
The Chart of the Day belongs to CRH Medical (CRHM). I found the medical products company by using Barchart to sort today’s Top Stocks to Own list first by the highest Weighted Alpha then again by technical buy signals of 80% or more. Since the Trend Spotter signaled a buy on 1/4 the stock gained 54.83%. CRH Medical Corporation offers products […]
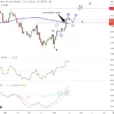
A Spike In The VIX
The general market finally followed its own leading breadth indicators lower today. This chart confirms that the downside of the medium-term trend is underway. Here is a look at the dates that show the turn-up and down for the cycle. Here is a look at the short-term. A new downtrend started yesterday, and it looks […]

Shopify, Inc. Should Be Added To Your Growth Stock Shopping List
Written by SmallCapPower.com Shopify, Inc. (NYSE/TSX: SHOP) has been making new highs since its IPO in May 2015, rallying 140%+ in the past year alone. Is this just the tip of the iceberg? Does Shopify have more room to run? To answer these questions this article explores the near-term catalysts in Shopify’s horizon as it scales to […]
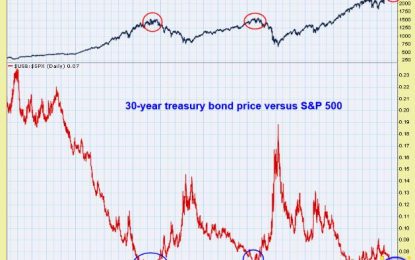
Is The US Stock Market Topping?
Here is the chart of the week: source: stockcharts.com The chart shows the 30-year treasury bond price to S&P 500 ratio. The blue circles show cyclical lows of this ratio. Note that these lows correlate with the tops printed by the US stock market (red circles), represented by the S&P 500 index. The one-million-dollar question is: […]
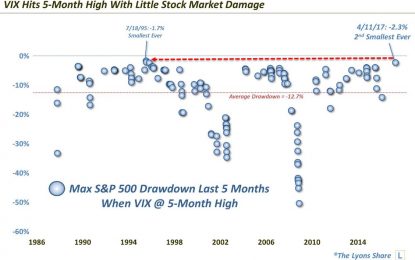
Long Bond, VIX, & Commodities Show Reflation Trade Is Over
The stock market had another small drawdown on Wednesday as it is down about 2.5% from its all-time high. The last 5% decline was in June 2016 which is about ten months ago. The minimal size of the stock market correction is remarkable when you look at in the context of other markets. As I […]
Agriculture Markets Report – Thursday, April 13
A review of the day’s trading in the agriculture markets. Video Length: 00:12:15
What Was Chinese Trade In March?
As with all statistics, there are discrepancies that from time to time may obscure the meaning or validity of the particular estimate in question. For the vast majority of the time, any such uncertainties amount to very little. Overall, harmony among the major accounts reduces the signal noise from any one featuring a significant inconsistency. […]
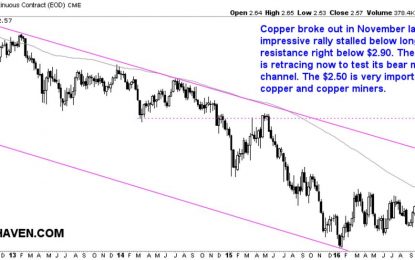
Copper Price: Tactical Bull Market Ending Once $2.50 Broken
Readers vividly remember how hot the copper market was just 2 months ago. That is when we wrote that copper’s chart looks spectacular as the metal attempted for the sixth time to break above $2.80. However, copper did not manage to go higher, even after so many breakout attempts. As it became clear that there was not […]
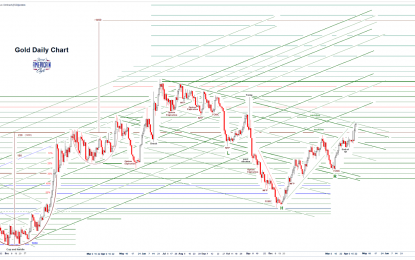
Stocks And Precious Metals Charts – Risk-Off – Maundy Thursday
Today was a ‘risk-off’ day in the market Some of this was due to geopolitical risks. The rest was in anticipation of a three-day weekend, with new political and geopolitical risks being anticipated. The US has to renew the debt ceiling, and despite being controlled by one party it remains dysfunctional, being sharply divided by […]