Commodity prices were in corrective mode yesterday after the prior session’s fireworks. Gold prices edged higher as the US Dollar retraced some of Tuesday’s gains while a cautious improvement in risk appetite helped buoy sentiment-sensitive crude oil prices. They rose alongside the bellwether S&P 500 index, seemingly ignoring EIA inventory data showing an unexpectedly large 4.85 million barrel build last week.
Looking ahead, the closure of US financial markets for the Thanksgiving holiday is likely to drain liquidity and dampen price action. Thin trading conditions might amplify kneejerk volatility in the event that a particularly potent bit of news hits the newswires unexpectedly. Market participants would be wise to question scope for follow-through on any such moves before participation levels rebuild.
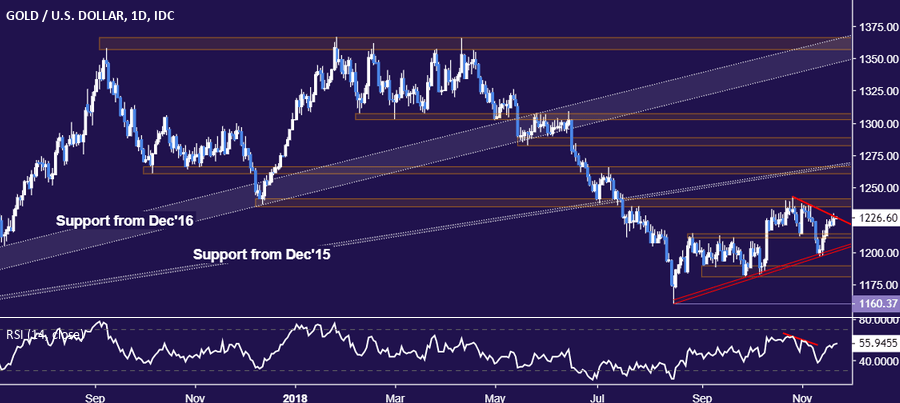
GOLD TECHNICAL ANALYSIS
Gold prices are testing a downward-sloping resistance line at 1227.09, with a daily close above that opening the door for a test of the 1235.24-41.64 area. Alternatively, a move below the chart inflection area in the 12.11.05-14.30 zone exposes counter-trend support at 1200.42. A breach of this level may mark resumption of the longer-term decline started in mid-April.
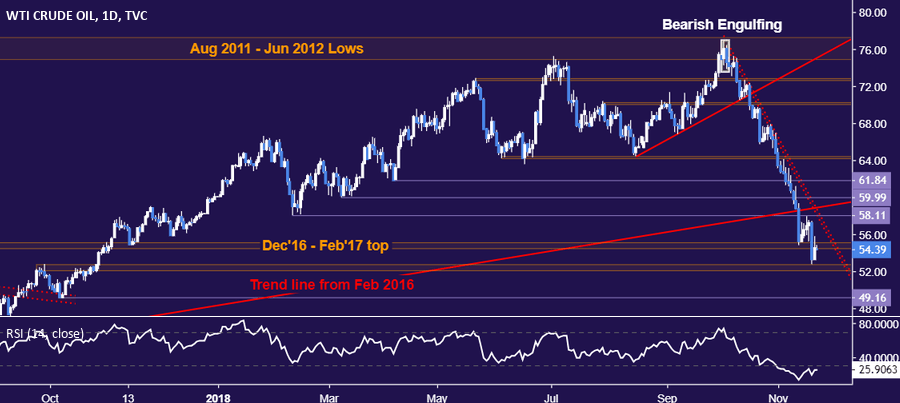
CRUDE OIL TECHNICAL ANALYSIS
Crude oil prices retested but conspicuously failed to close above support-turned-resistance in the 54.48-55.21 area. From here, a turn lower that breaches below the 52.34-83 zone paves the way to challenge the October 2017 low at 49.16. Alternatively, a daily close above 55.21 targets the February 9 low at 58.11.