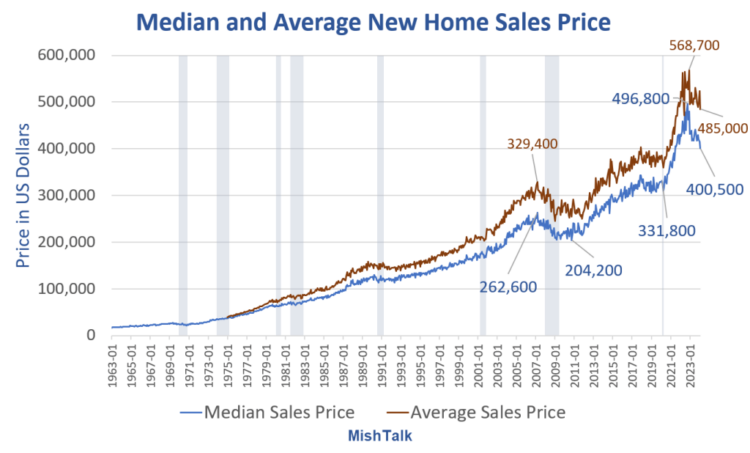
 New Home Sales Prices from the Commerce Department, chart by Mish.
New Home Sales Key Points
New Homes Sold vs Sales Price New Home Sales data from the Commerce Department, chart and calculations by Mish.
Commerce data on new homes is very volatile and subject to huge revisions. Seasonal adjustments are a mess. To help smooth away some of the wild fluctuations, I calculated 3-month rolling averages.On a rolling average basis, seasonally-adjusted, new home sales peaked at 1.015 million in October of 2020. On an monthly basis (not shown), sales peaked at 1.029 million in August of 2020.Sales volume declined drastically from October 2020 to the bottom in November of 2022 at a three-month moving average of 575,000. That’s a decline of 43.3 percent.At that point, home builders decided they would rather build more houses cheaper than fewer, more-expensive houses.
Three-Month Moving Average Changes
The price moving averages both peaked in December of 2022.
What Are You Getting?Price is down but so are room sizes, the number of rooms, lot sizes, amenities, and landscaping.You are not getting the same house for $400,500 as you did for $496,800. I question the claim that houses are now more affordable.It’s like saying a bicycle is more affordable than a motorcycle, or cheese is more affordable than moon rocks.
New Home Sales Since 1963  New Home Sales from the Census Bureau New Residential Construction report, chart by Mish.
Earlier today, I noted New Home Sales Little Changed in FebruaryNew home sales are about where they were in July of 1963 (blue highlights).Sales are down 35.7 percent from the August 2020 seasonally-adjusted annualized peak of 1,029.
New Homes For Sale By Stage of Construction 
Allegedly, there are 463,000 new homes for sale. But 106,000 of them have not even started.85,000 are completed and another 272,000 are under construction. Data only dates to 1999, but the number under construction is on the upper end of the range.Builders are optimistic they can sell the homes they have started.The number of homes for sale and homes under construction may be flashing some serious warning signs. Both are at or above levels that preceded prior downturns.Many of those who want to buy are priced out and have other financial difficulties.
Credit Card and Auto Delinquencies SoarCredit card debt surged to a record high in the fourth quarter. Even more troubling is a steep climb in 90 day or longer delinquencies. ![]()
Record High Credit Card DebtCredit card debt rose to a new record high of $1.13 trillion, up $50 billion in the quarter. Even more troubling is the surge in serious delinquencies, defined as 90 days or more past due. For nearly all age groups, serious delinquencies are the highest since 2011.
Auto Loan Delinquencies ![]() Serious delinquencies on auto loans have jumped from under 3 percent in mid-2021 to to 5 percent at the end of 2023 for age group 18-29. Age group 30-39 is also troubling. Serious delinquencies for age groups 18-29 and 30-39 are at the highest levels since 2010.
Serious delinquencies on auto loans have jumped from under 3 percent in mid-2021 to to 5 percent at the end of 2023 for age group 18-29. Age group 30-39 is also troubling. Serious delinquencies for age groups 18-29 and 30-39 are at the highest levels since 2010.
Generational Homeownership Rates  Home ownership rates courtesy of Apartment ListThe above chart is from the Apartment List’s 2023 Millennial Homeownership ReportThose struggling with rent are more likely to be Millennials and Zoomers than Generation X, Baby Boomers, or members of the Silent Generation.The same age groups struggling with credit card and auto delinquencies.
ConclusionsTwo different polls show millennials and zoomers are unhappy. And they are unhappy for the reasons I stated.Many have concluded they will never be able to afford a house or have kids. Those who have concluded that are likely correct.For more discussion, please see US Drops to Number #23 in the World Happiness Report
Home AffordabilityEarlier today I asked “Are we about to run out of people who want a home and can afford a home?”Declining price suggests that.Builders have stabilized the number of transactions, for now. But it’s at the expense of price.The people who most want to buy (zoomers and millennials) are very much priced out with mortgage rates near 7.0 percent, while getting less and less for their money.A average decline of $44,734 from the moving-average peak ($67,800 from the median peak) did not make homes affordable.The new home sales transaction rebound (second chart) peaked at 707,000, New sales are now 660,000, a decline of about 6.2 percent despite declining prices.Meanwhile, based on the number of homes under construction, homebuilder optimism is still rising (4th chart).Homebuilders are stretched and may finally be a decent short. That’s an observation, not advice.More By This Author:New Home Sales Little Changed In February In The Next 5 Years Employment In Age Groups 60+ Will Drop By ~12.5 Million Existing Home Sales Surge 9.5 Percent, Median Sales Price Up 8th Month