 Image Source: Pixabay
What do households (not economists) think inflation will be in three years? I use the deviation of forecast from target as a proxy measure for credibility regarding inflation.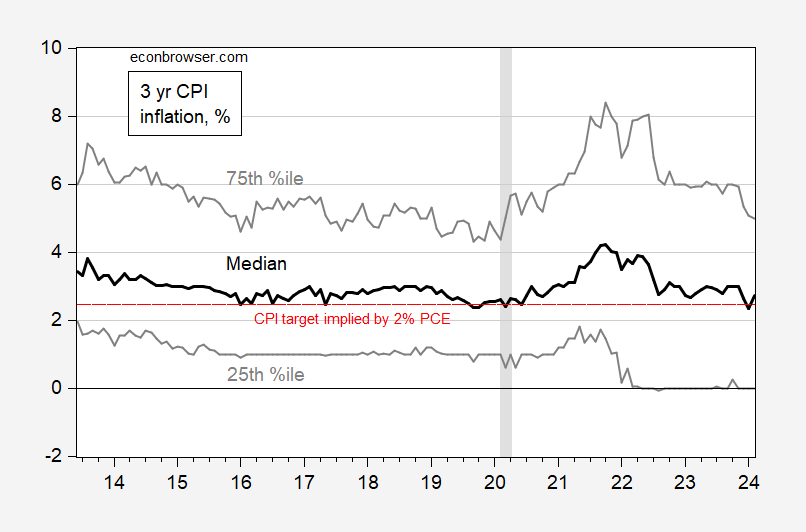 Figure 1: Median 3 year CPI inflation forecast (black), 25th, 75th percentile (gray), in %. CPI inflation consistent with 2% PCE inflation target (red dashed line). NBER defined peak-to-trough recession dates shaded gray. Source: NY Fed, NBER, and author’s calculations.
As of February 2024, the inflation rate expected 3 years out is lower than it was in January 2021. While expected CPI inflation has declined, dispersion of forecasts has increased slightly.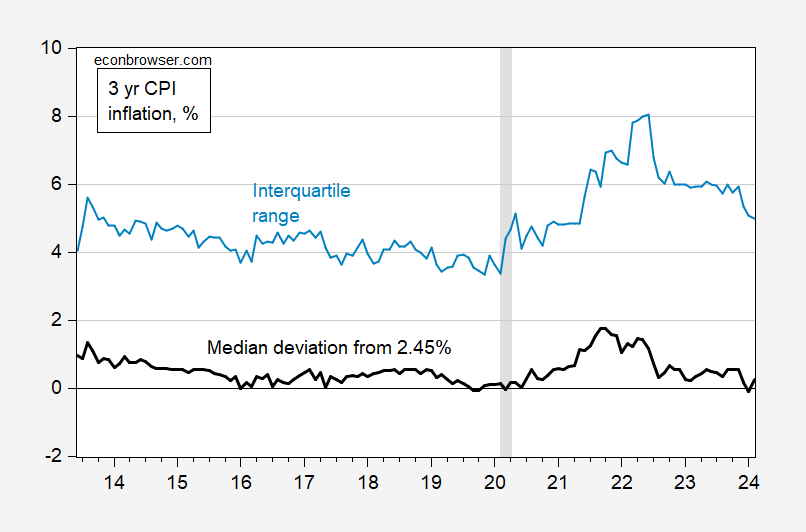 Figure 2: Median 3 year CPI inflation forecast deviation fromCPI inflation consistent with 2% PCE inflation target (black), interquartile range (sky bule), in %.. NBER defined peak-to-trough recession dates shaded gray. Source: NY Fed, NBER, and author’s calculations.Maximal uncertainty, as measured by the interquartile range in 3 year inflation was reached in mid-2022. It’s now dropped to to rates last seen at the exit from the pandemic-induced recession.Note that some have questioned the use of the earlier framework,pre-New Monetary Strategy laid out in August 2020 (see here for one reader’s critique). I’ll note that as far as I can tell, market commentators are still using the target in the old sense of the word (a sense that seems buttressed by Papell and Prodan-Boul’s recent examination of the various vintages of the SEP), rather than FAIT with, say, a 3 year window, as that would imply we should be seeing an implied target rate of deflation at about 0.8% per annum.
More about measuring credibility, see e.g. Bordo and Siklos (2017), Bicchal (2022).More By This Author:Conference Board Revises 2024 Outlook Up
Are You Better Off Than You Were 4 Years Ago
FOMC March SEP On GDP