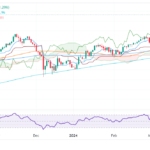
Image Source: UnsplashShort Term Elliott Wave view in S&P 500 (SPX) suggests cycle from 1.6.2024 low is in progress as a 5 waves impulse. Up from 1.6.2024 low, wave ((i)) ended at 4931.09 and pullback in wave ((ii)) ended at 4845.15. Wave ((iii)) higher ended at 5187.78 as the 30 minutes chart below shows and pullback in wave ((iv)) ended at 5095.88. The Index has resumed higher in wave ((v)) with subdivision as another 5 waves in lesser degree.Up from wave ((iv)), wave (i) ended at 5179.87 and dips in wave (ii) ended at 5105.28. Index resumed higher in wave (iii) towards 5261.1. Pullback in wave (iv) ended at 5203.42. Internal subdivision of wave (iv) unfolded as a double three Elliott Wave structure. Down from wave (iii), Wave A ended at 5229.87 and Wave B ended at 5246.09. Wave C lower ended at 5216.32 which ended wave W. Rally in wave X ended at 5234.7. Down from wave X, wave A ended at 5225.05and wave B ended at 5230.38. Index then resumed lower in wave C towards 5203.42 which completed wave Y of (iv). Near term, as far as pivot at 5105.28 stays intact, expect dips to find support in 3, 7, 11 swing for further upside.S&P 500 (SPX) 30 Minutes Elliott Wave Chart
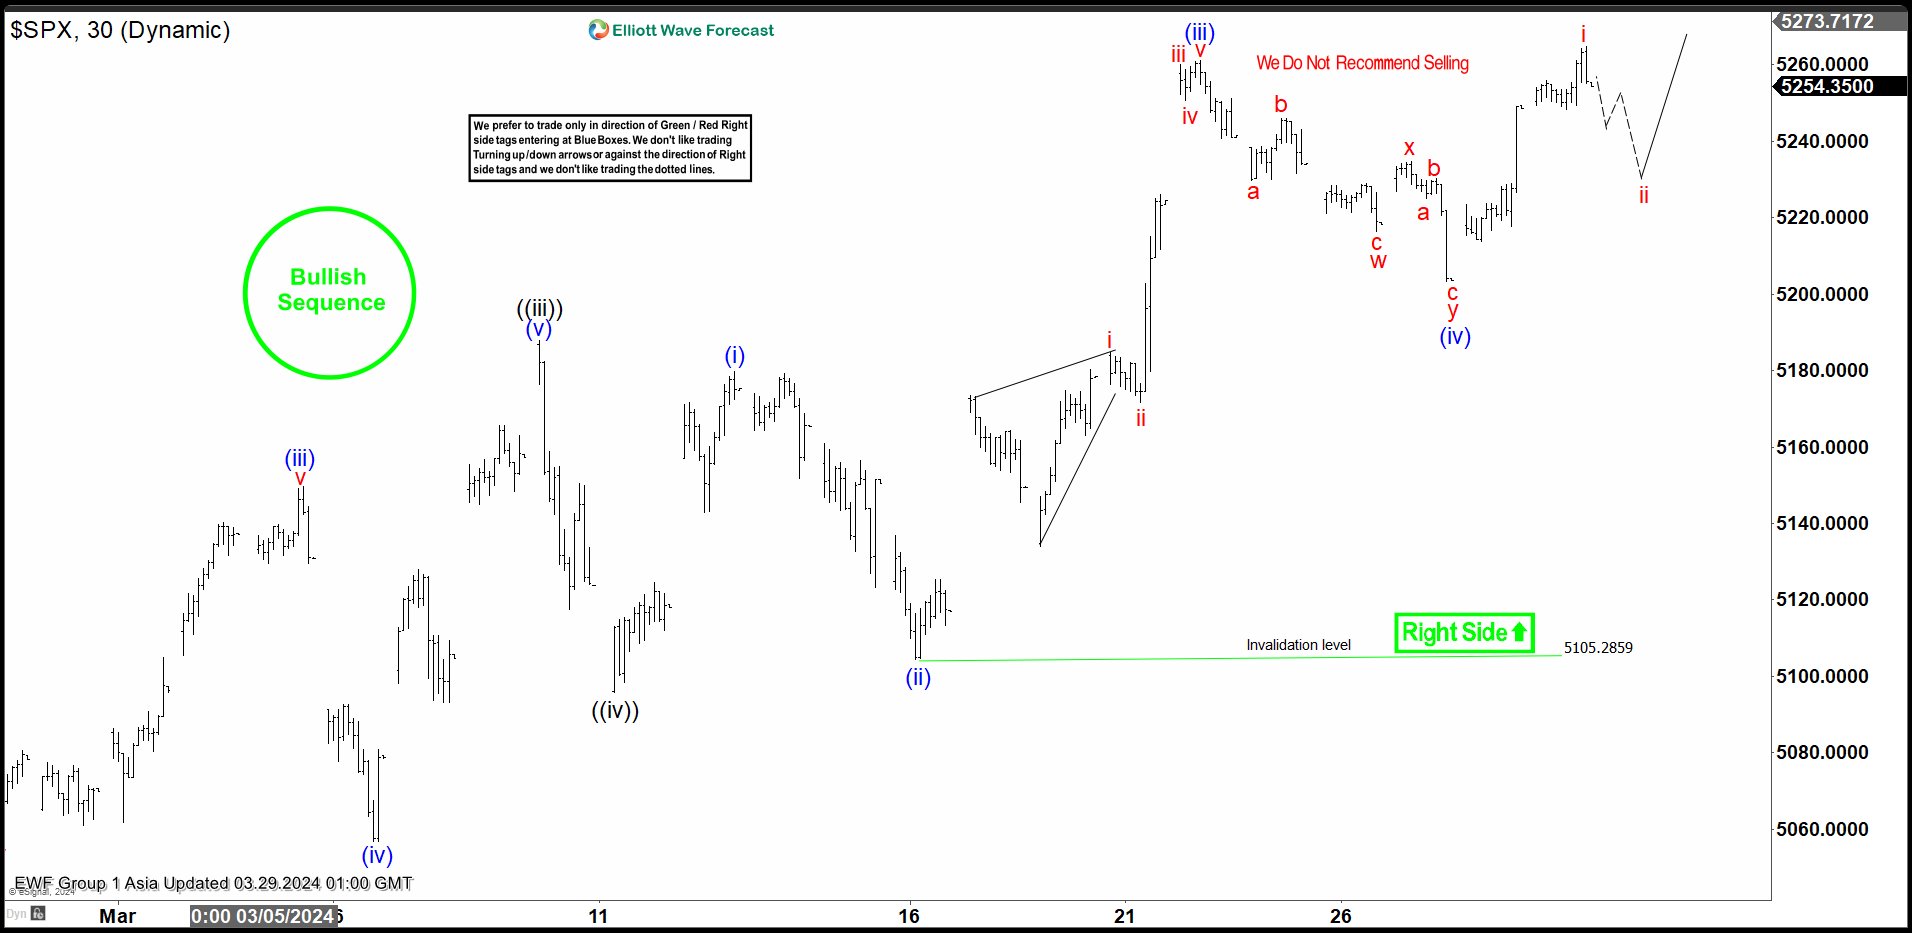 S&P 500 (SPX) Elliott Wave VideoVideo Length: 00:05:11More By This Author:Nasdaq 100 Potential Support AreaNikkei Looking To End Impulsive Rally Block, Inc. 50% Move On The Horizon
 User rating: 0.00% ( 0