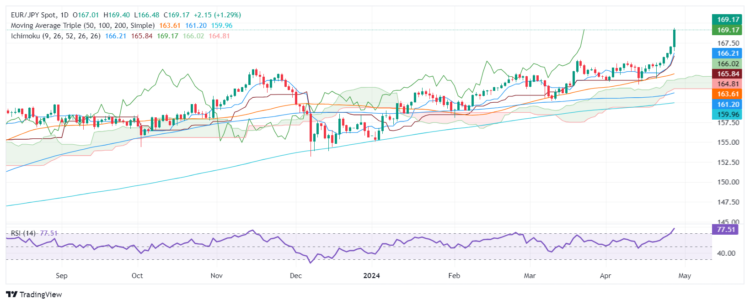
The EUR/JPY rallies toward the 169.00 figure yet remains shy of breaching it as risk appetite improves, as Wall Street depicts. At the time of writing, the cross-pair trades at 168.89 and is up by 1.12%. EUR/JPY Price Analysis: Technical outlookThe daily chart depicts the EUR/JPY as upward biased, even though the rally has overextended. The Relative Strength Index (RSI) is at 76.00, usually seen as overbought, but due to the strength of the uptrend, the 80.00 level is seen as the most extreme condition.If buyers reclaim the 169.00, the next supply zone would be the July 2008 high of 169.97. Once those two levels are cleared, the next supply zone would be 170.00.On the flip side, a daily close below 169.00, would pave the way for a retracement to 168.00. Subsequent losses are seen below the Tenkan-Sen at 166.20, followed by the Kijun-Sen at165.84 EUR/JPY Price Action – Daily Chart 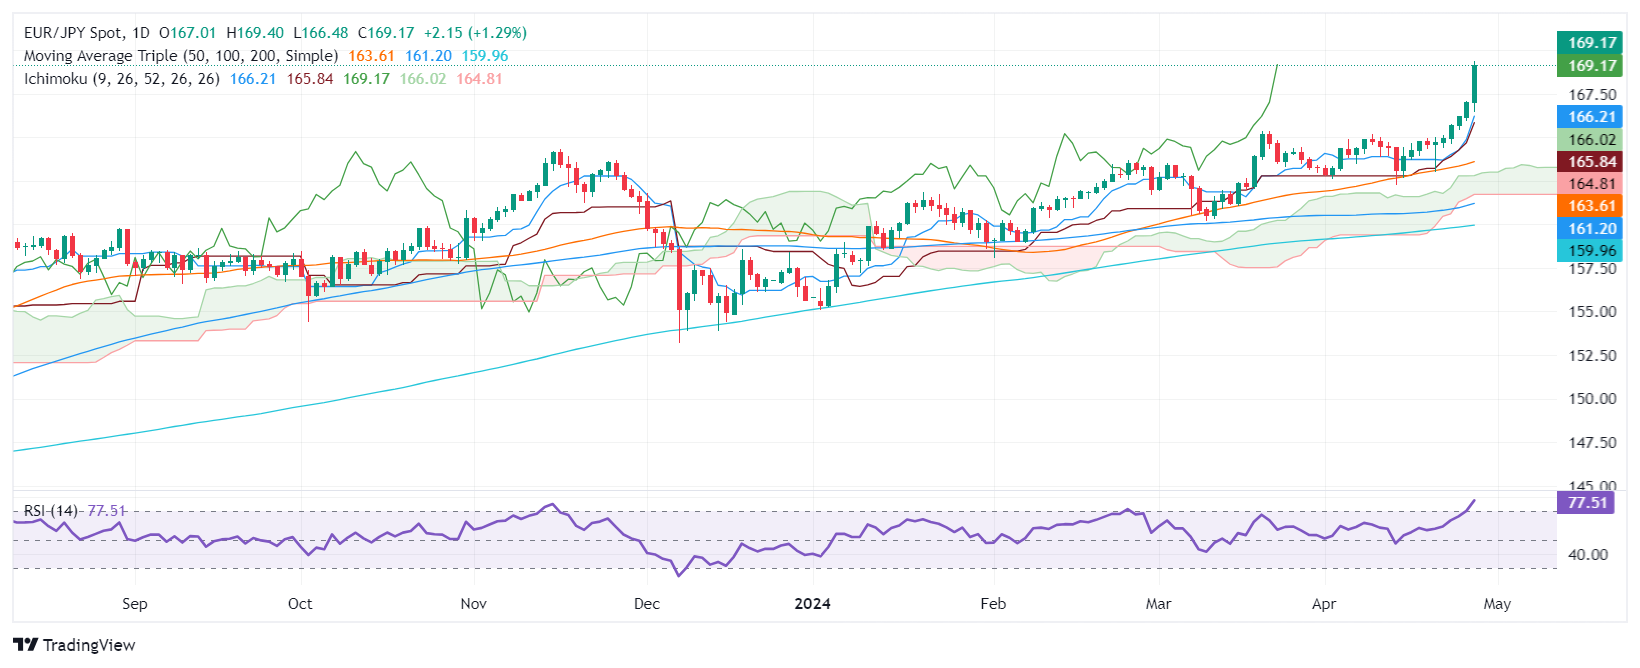 EUR/JPY
More By This Author:GBP/USD Price Analysis: Poised To Resume Downtrend, Despite ‘Morning Star’ Formation AUD/USD Rises To Two-Day High Ahead Of Aussie CPIGold Slides As Middle East Tensions Abate, Ahead Of US PCE Data