Image Source: Pexels
MARKETSFriday saw a rebound in US stocks, fueled by optimistic forecasts for Alphabet (GOOG, GOOGL) and Microsoft (MSFT) earnings, reigniting hopes for a sustained rally led by Big Tech. However, gains were tempered by lingering concerns over stubborn inflation, which drives yields higher. Geopolitical tensions added another layer of caution, particularly evident in the underlying bid in oil markets on Friday, highlighting the weekend gap risk.The S&P 500 (^GSPC) gained 1%, while the Nasdaq Composite (^IXIC), with its tech-heavy composition, surged 2%. The Dow Jones Industrial Average (^DJI) also posted a modest increase of 0.4% or 150 points, albeit with fewer tech stocks.The stellar performance of Alphabet and Microsoft, boasting rises of approximately 10% and 2%, respectively, continued to underpin market sentiment. Their robust results underscored the growing demand for AI, particularly in driving cloud revenue, signaling potential benefits for both companies amid this boom. Alphabet’s market cap crossing the $2 trillion mark further solidified its position among elite market players.Investors closely observed the recent release of the Fed’s preferred inflation metric, the March personal consumption expenditures price index. The “core” measure, which excludes food and energy costs, showed a 2.8% year-over-year increase, slightly exceeding expectations but in line with the previous annual uptick. Overall, the outcome aligned with expectations, with the GDP price index providing a preview of the subsequent PCE data, indicating that the worst-case scenario had already been factored into market sentiment.Against this backdrop, Wall Street has significantly revised its expectations for Fed rate cuts in 2023. Traders have shifted their bets from initially anticipating seven cuts to now predicting just one, reflecting a recalibration of monetary policy expectations in response to evolving economic conditions.
Inflation Seasonality?In what could have been a more dire inflation report, the latest data on personal income and spending revealed stronger-than-expected spending last month, while core inflation stubbornly persisted. Given the earlier concerns surrounding the advance read on Q1 GDP and the significant overshoot on the core price index, traders were understandably on edge regarding the implications for March PCE.However, Friday’s personal income and spending report provided some relief. The month-over-month core PCE print was expected at 0.3%, albeit unrounded at 0.31675%. While the prior two months were revised higher, particularly January, which saw a significant revision, traders largely focused on the unrounded figure for that month.On a 12-month basis, core price growth on the Fed’s preferred gauge stood at 2.8%, slightly warmer than expected. Despite this, the market reaction was relatively subdued, considering Thursday’s unsettling overshoot on the GDP index. The unrounded year-over-year print actually saw a slight decrease from February’s upwardly revised figures.It’s worth noting that a MoM core print of 0.31675% is still on the warm side and may not effectively contribute to restoring price stability as desired. However, given the shifting context leading up to Friday’s release, particularly in light of the previous session’s quarterly index overshoot, the reported figures were not as disastrous as initially feared.Overall, Friday’s release provided some constructive signs, albeit within the existing circumstances and with certain caveats. The March PCE prices data hinted at a revival of the notion that the resurgence in inflation pressures might have been primarily a seasonal phenomenon confined to January. It’s worth noting that PCE data for February was more favourable than CPI, and the trend continued into March.However, despite these positive developments, the situation remains precarious, with each data release keeping investors on edge. We’re still far from the slow, predictable disinflation scenario that the Fed believes would warrant considering rate cuts.
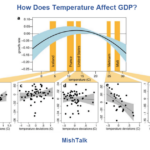
CRUDE OIL MARKETSCrude oil prices have recently experienced a welcome easing, alleviating concerns for both central bankers and consumers. Speculation surrounding the possibility of benchmark West Texas Intermediate (WTI) breaching the US$100/bbl mark has subsided, at least for now. The risk of disruptions to Iranian production has diminished following Israel’s measured response to prior drone attacks. However, crude oil markets are expected to remain volatile due to uncertainty surrounding the pace of global oil demand growth, increasing non-OPEC+/U.S. production, potential supply disruptions in Russia and the Middle East, and, crucially, OPEC+’s future production strategy.OPEC+’s concerted efforts to implement production cuts have largely supported oil prices over the past year. However, internal tensions within the cartel persist, leading to a significant portion of the cuts being voluntary. The sustainability of these cuts is questionable, particularly as certain members, notably the UAE, continue to exceed their quotas. This dynamic strains the cartel’s overall cohesion, with the unity of OPEC+ heavily reliant on Saudi Arabia’s willingness to bear the brunt of production adjustments.Meanwhile, Saudi Arabia faces mounting fiscal pressures, reflected in the International Monetary Fund’s (IMF) projection of the country’s fiscal breakeven crude oil price reaching US$96/bbl in 2024. Although the IMF anticipates a decline in breakeven prices by 2025, this is contingent upon the rollback of production cuts. It’s worth noting that these projections do not necessarily align with Riyadh’s actual price targets but provide insight into the level of crude oil prices needed to mitigate budget deficits.
The International Monetary Fund’s calculations underscore the significance of elevated crude oil prices for key OPEC+ members beyond Saudi Arabia. Both Kuwait and Iraq rely on oil prices above $80 and $90, respectively, to prevent significant deterioration in their budget balances. In contrast, the UAE demonstrates more resilience to lower prices, with its fiscal breakeven oil price estimated at a comparatively modest $57. Saudi Arabia, Iraq, Kuwait, and the UAE account for approximately 90% of the cartel’s total production cuts.While the IMF has not provided a specific estimate for Russia’s fiscal breakeven oil price, it is conservatively assumed to fall within the $90-to-$100 range. This collective dependence on higher oil prices among key OPEC+ members underscores the importance of maintaining unity within the cartel. Consequently, these dynamics will likely reinforce OPEC+’s commitment to the current production cut strategy throughout the year.
FOREX MARKETSThe week concluded with a notable yen depreciation (+158 USDJPY) following the Bank of Japan’s decision to maintain its policy stance unchanged, coupled with a lack of apparent concern regarding the yen’s ongoing decline. This has instilled a belief among market participants that there may be more room for yen depreciation than previously anticipated. In the absence of intervention by the Ministry of Finance, USD/JPY is poised to ascend rapidly towards the 160 level. Given the consistent rhetoric from the Ministry of Finance opposing such movements, we continue to assert that intervention is imminent and could occur at any moment, potentially even during the upcoming Golden Week holiday.The USD has experienced a loss of momentum over the past week, ranking as the third worst-performing G10 currency after the JPY and CHF. Despite US yields reaching fresh year-to-date highs, the USD has struggled to sustain its upward trajectory against most G10 currencies. The 10-year US Treasury yield peaked at 4.74%, marking a substantial increase of approximately 56 basis points since the end of the previous month. This surge in yields is on track to register the largest monthly gain since September 2022, coinciding with the initiation of Japan’s intervention to bolster the JPY between September and October 2022.One contributing factor to this trend is undoubtedly the rise in European yields, driven by an improving cyclical outlook in Europe. Additionally, there’s a growing perception of central bank synchronization with the Federal Reserve, further influencing currency dynamics.Correlation analysis indicates that USD/JPY has exhibited a stronger correlation with long-term US yields than short-term US yields over the past month. The ongoing uptrend in long-term US yields continues to exert upward pressure on USD/JPY, intensifying the coercion on Japan to intervene to support its currency. However, it may only be effective once US yields stop rising and actually reverse course lower.In March, my forecast for a weaker US dollar proved consistently off the mark as sticky US inflation was a cause for some frustration. Nonetheless, I maintain my projection for a weaker USD in the latter half of this year. This expectation rests on the premise that the US economy’s exceptional performance will fade as growth dynamics shift, with other global regions, such as China and the eurozone, gaining momentum.While the US economy did slow to a 1.6% growth rate in Q1, there are encouraging signs in the resilience of private domestic demand, which expanded by over 3% for the third consecutive quarter, excluding inventories.This strength suggests that despite the tightening of Fed policy and the gradual depletion of COVID-related savings, the US economy retains underlying vitality.
CHARTS OF THE WEEKCore personal consumer expenditure deflator – MoM%, 3M annualised% & YoY%. 
The Housing Affordability Index was reported by the National Association of Realtors (NAR) at 103.0 in February, tracking at (26%) below the historical average of 138.3. More By This Author:Amid Macro Skepticism , Alphabet And Microsoft Shone Through
Meta Takes A Guidance Slide Amidst The Battle Between Yields And Earnings
Earnings Deliver In Spades