 Image Source: Pixabay
AUDJPY Elliott Wave Analysis Trading Lounge Day Chart, Australian Dollar / Japanese Yen (AUDJPY) Day Chart AUDJPY Elliott Wave Technical AnalysisFUNCTION: Counter Trend MODE: impulsive as C STRUCTURE: red wave C POSITION: blue wave Z DIRECTION NEXT LOWER DEGREES: black wave C DETAILS red wave B of Z looking completed, now red wave C of Z of B looking started. Wave Cancel invalid level:97.779 The AUD/JPY Elliott Wave Analysis for the Day Chart provides an overview of the current market trend and likely future developments in the Australian Dollar/Japanese Yen currency pair, utilizing the principles of Elliott Wave Theory.FunctionThe function of this analysis is described as “Counter Trend.” This indicates that the current wave structure represents a corrective move against the primary trend. Counter-trend movements often suggest a retracement or a temporary shift in market direction.ModeThe mode for this chart is specified as “impulsive as C.” This mode denotes a stronger directional movement within the Elliott Wave structure, indicating that the current counter-trend may contain a significant shift or wave progression.StructureThe structure is identified as “red wave C,” which typically indicates the final stage of a corrective pattern. This aligns with the function of the analysis, pointing towards a potential transition from correction to a new impulsive phase.PositionThe position within the broader Elliott Wave structure is “blue wave Z.” This position implies that the current pattern is in a complex corrective phase, potentially consisting of multiple interconnected corrective waves. Direction for the Next Lower DegreesThe analysis suggests that the next lower degree trend is toward “black wave C.” This provides a directional cue, indicating where the trend is likely to head following the current wave structure.DetailsThe analysis mentions that “red wave B of Z” appears to be completed, suggesting that a key part of the corrective cycle has ended. This is significant because it denotes the beginning of a new phase, specifically “red wave C of Z of B.” This structure could represent the start of a more substantial movement within the current Elliott Wave pattern, indicating a shift in momentum.The “Wave Cancel invalid level” is listed at 97.779. This level is crucial for understanding where the current wave structure might break down. If the market moves past this point, the current analysis could be invalidated, requiring a new interpretation of the Elliott Wave structure.In summary, the analysis outlines a transition in the AUD/JPY pair from a corrective phase to a potentially more impulsive structure. It provides key points to watch for traders and analysts, indicating possible changes in market direction. The critical invalidation level gives traders a boundary for risk management, serving as a guide for trading decisions and strategy adjustments.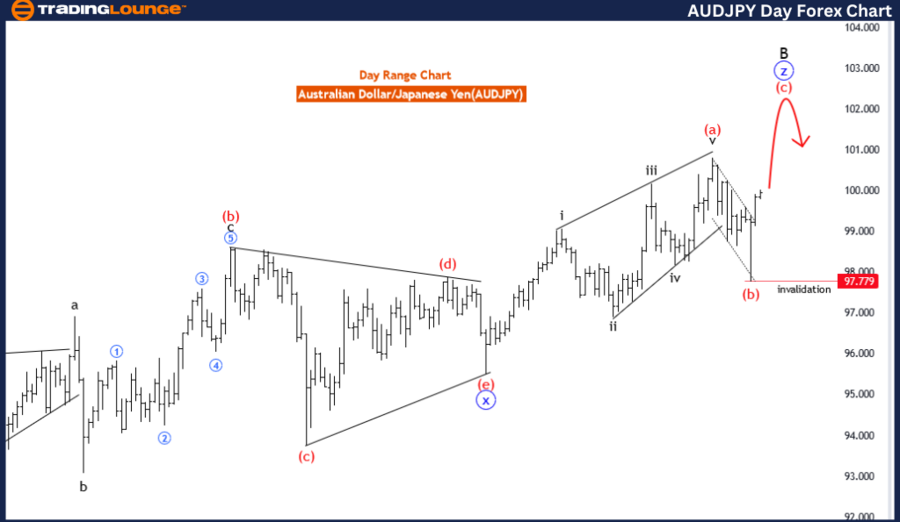 AUDJPY Elliott Wave Analysis Trading Lounge 4 Hour Chart, Australian Dollar / Japanese Yen (AUDJPY) 4 Hour Chart AUDJPY Elliott Wave Technical AnalysisFUNCTION: Counter Trend MODE: impulsive as C STRUCTURE: red wave C POSITION: blue wave Z DIRECTION NEXT HIGHER DEGREES: red wave C (started) DETAILS red wave B of Z looking completed, now red wave C of Z looking started . Wave Cancel invalid level:97.779 The AUD/JPY Elliott Wave Analysis for the 4-Hour Chart provides insights into the current market trends and future projections for the Australian Dollar/Japanese Yen currency pair using the Elliott Wave Theory.FunctionThe function of this analysis is identified as “Counter Trend.” This suggests that the current market structure is moving in opposition to a broader, larger trend. Counter-trend movements often signal corrections or retracements within a larger trend.ModeThe mode described in this analysis is “impulsive as C,” indicating that the ongoing wave pattern is impulsive and represents a final phase of a correction. Impulsive waves generally signify more substantial and direct price movements within the Elliott Wave structure.StructureThe structure for this analysis is noted as “red wave C,” indicating that the market is in the final phase of a corrective cycle. This structure aligns with the counter-trend function, suggesting a more substantial correction in progress, possibly signaling the beginning of a new trend or the resumption of the broader trend.PositionThe position within the Elliott Wave cycle is listed as “blue wave Z,” indicating a higher degree of complexity and possible combination patterns. This is part of a larger structure that often involves multiple corrective waves interconnected in a larger pattern.Direction for the Next Higher DegreesThe analysis points towards “red wave C,” indicating that the current impulsive phase could lead to a broader continuation of the trend, suggesting a transition from correction to impulsion.DetailsThe details provided in the analysis indicate that “red wave B of Z” is looking completed, suggesting that a key part of the correction phase has ended. The analysis identifies that “red wave C of Z” is likely beginning, which represents a more substantial impulsive movement in the current cycle. This is a potential signal for traders to watch for continuation patterns.The “Wave Cancel invalid level” of 97.779 is crucial. This level acts as a boundary; if breached, the current Elliott Wave pattern becomes invalid, necessitating a re-evaluation. This invalidation level is critical for traders and analysts as it guides their risk management strategies.In summary, the analysis describes a complex Elliott Wave structure, focusing on the transition from a corrective phase to a more impulsive one. It underscores significant points for traders to watch, indicating potential directional shifts in the market.Technical Analyst: Malik Awais
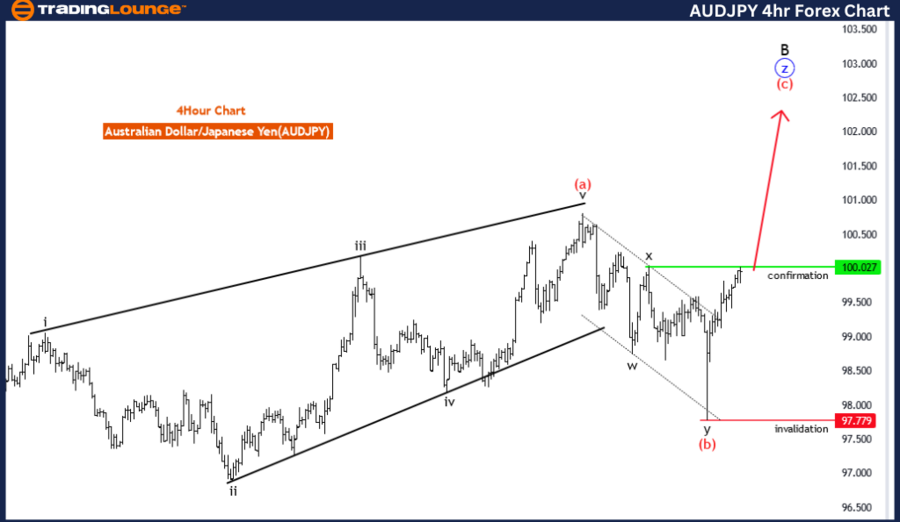 More By This Author:Elliott Wave Technical Analysis: Binance Crypto Price News For Tuesday, April 23
Elliott Wave Technical Analysis: Visa Inc. – Monday, April 22
Elliott Wave Analysis: Natural Gas