
 Image Source: Pixabay
EUR/USD extends its holding pattern of the last few days, trading in the mid 1.0600s on Tuesday, prior to the release of potentially market-moving purchasing manager survey data. Preliminary Purchasing Manager Indexes (PMI) for April in both the United States and Europe are scheduled for release later in the day and could impact the exchange rate.
EUR/USD: Traders await Purchasing Manager data
EUR/USD could potentially experience volatility after the release of HCOB PMIs for the Eurozone followed by S&P Global PMIs for America, during the US session. The HCOB Composite PMI for the Eurozone is forecast to rise to 50.8 from 50.3 in March, the HCOB Manufacturing PMI to 46.5 from 46.1, and the HCOB Services PMI to 51.8 from 51.5. The S&P Global Manufacturing PMI for the US in April is forecast to rise to 52.0 from 51.9 and Services to 52.0 from 51.7. A PMI figure above 50 is indicative of growth in the sector; below 50 contraction. If any of the data show higher-than-expected readings, they could benefit the respective currencies and vice versa for lower-than-forecast results. Of particular interest to currency traders will be Services PMIs since sticky inflation in the sector has been a major contributor to inflation, especially in the US. Continued high inflation in the US is viewed as likely to keep interest rates relatively elevated in the United States compared to Europe. The expectation of higher borrowing costs for longer in the US has been bolstering the US Dollar (USD) since higher interest rates attract greater capital inflows. In addition, later in the day, the US will also see the release of New Home Sales data for March and the Richmond Fed Manufacturing Index for April.
Technical Analysis: EUR/USD forms a Bear Flag
EUR/USD is trading in a rectangular range at roughly the same level as the 100-week Simple Moving Average (SMA). Taken together with the steep decline that preceded the rectangle, the whole formation resembles a Bear Flag price pattern, which has bearish connotations.
EUR/USD 4-hour Chart
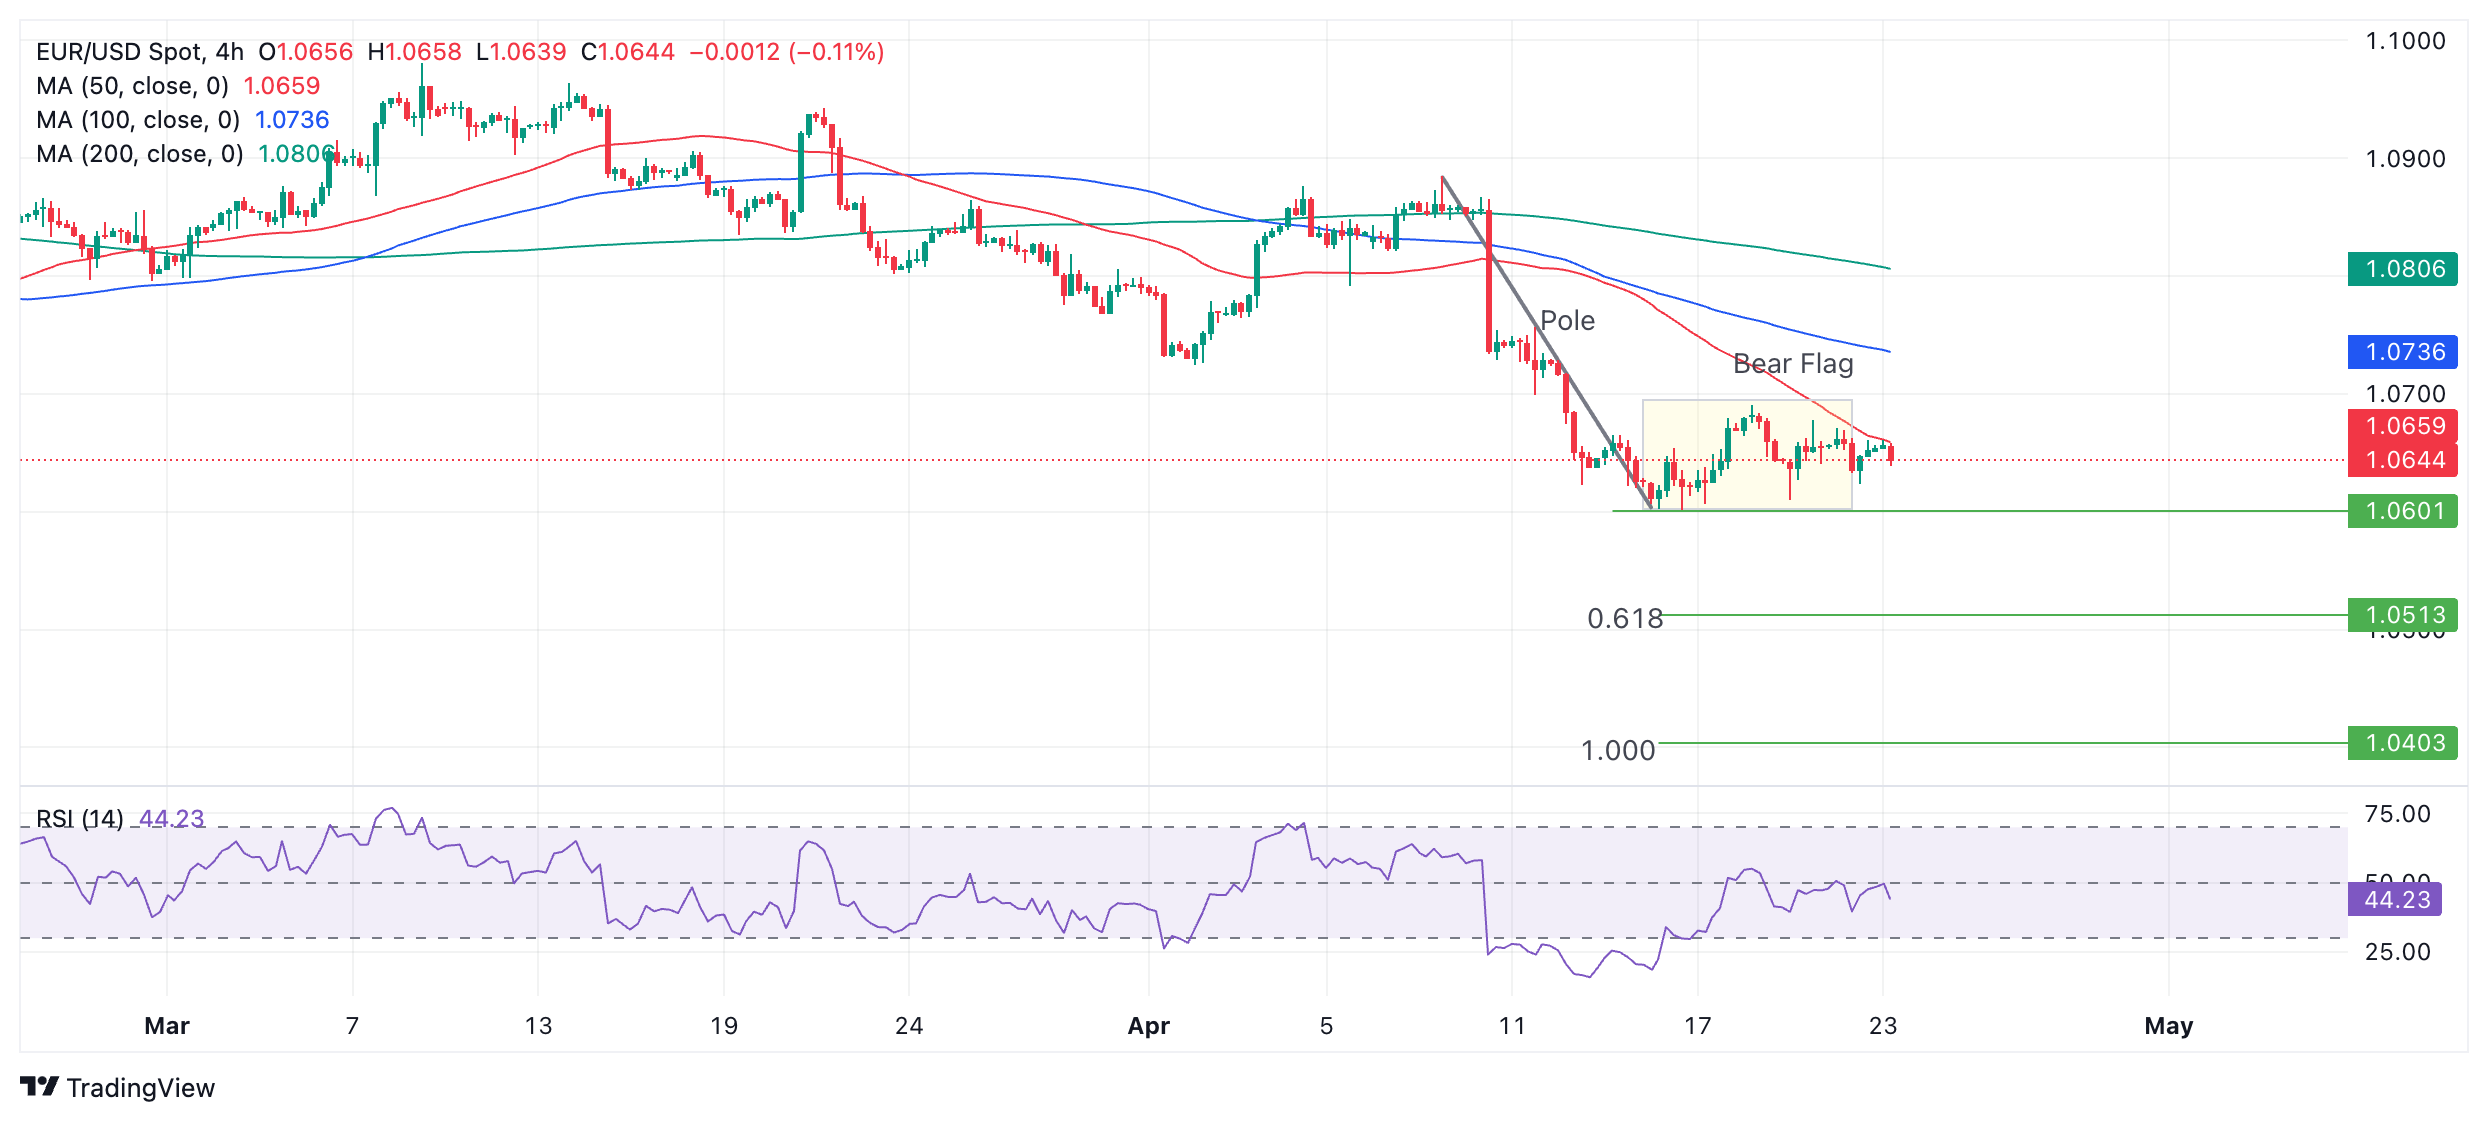 A break below the 1.0601 April 16 low would signal a probable activation of the Bear Flag and the start of a decline. According to technical lore, the expected move out of a Bear Flag usually equals the length of the “pole” or steep decline preceding the box-like formation of the flag square, or a Fibonacci ratio of the pole. The Fibonacci 0.618 ratio of the pole extrapolated lower provides the most reliable conservative target. This gives a price objective at 1.0503. After that, the next concrete target is at 1.0446 – the October 2023 low. A fall of equal length to the pole would take EUR/USD down to 1.0403. The Relative Strength Index (RSI) has exited oversold conditions, indicating renewed potential for more downside. For bulls, resistance at around 1.0700 will need to be overcome to have any hope of recovery. After that, the April 2 swing low at 1.0725 provides the next upside target, followed by 1.0800, where a cluster of major Moving Averages coils.More By This Author:USD/CAD Price Analysis: Remains Subdued Near 1.3700 As US Dollar Slips EUR/USD Gains Relief From Easing Geopolitical Tensions EUR/GBP Price Analysis: What Are The Breakout Levels Of The Three-Month Range?