 Photo by Colin Watts on Unsplash
GBPUSD Elliott Wave Analysis Trading Lounge Day Chart, British Pound/U.S.Dollar(GBPUSD) Day Chart GBPUSD Elliott Wave Technical AnalysisFUNCTION: Counter Trend MODE: Impulsive as A STRUCTURE: red wave 3 POSITION: blue wave A DIRECTION NEXT HIGHER DEGREES: blue wave 4 DETAILS:red wave 2 of A completed at 1.17096 , now red wave 3 is in play . Wave Cancel invalid level: 1.27096 The GBP/USD Elliott Wave Analysis for the Daily Chart explores the British Pound versus the U.S. Dollar using the Elliott Wave framework. This analysis provides a structured view of the market trends, focusing on counter-trend waves and their implications for traders and analysts.FunctionThe function of this analysis is identified as “Counter Trend,” suggesting that the observed wave patterns represent a phase that moves against the prevailing longer-term trend. This could imply a corrective movement within a broader trend, indicating a temporary reversal or consolidation before the primary trend resumes.ModeThe mode is categorized as “Impulsive as A,” indicating that the current wave structure represents an impulsive move typically found at the beginning of a new wave cycle. This mode generally suggests a strong, directional movement, often indicating the initial stages of a larger trend shift.StructureThe structure is noted as “red wave 3,” highlighting an impulsive wave that typically denotes a continuation of a broader trend. Red wave 3 within this context could signify a strong push in the counter-trend direction.PositionThe position in the Elliott Wave sequence is “blue wave A,” indicating that the observed pattern is part of an impulsive phase. This position often aligns with a larger correction within a broader trend, suggesting that the current impulsive phase is still part of a counter-trend movement.Direction for the Next Higher DegreesThe anticipated direction for the next higher degrees is “blue wave 4,” indicating that once the current wave completes, the structure will likely transition to a corrective phase. Blue wave 4 typically represents a temporary retracement within a broader impulsive pattern.DetailsThe analysis specifies that red wave 2 of wave A completed at 1.17096, with red wave 3 now in play. This implies that the current impulsive wave is expected to continue, potentially leading to a broader counter-trend movement. The Wave Cancel invalid level is set at 1.27096, indicating a critical threshold. If the price crosses this level, it would invalidate the current wave structure, necessitating a reevaluation of the Elliott Wave count.In summary, the GBP/USD Elliott Wave Analysis on the Daily Chart describes a counter-trend movement with an impulsive mode, focusing on red wave 3 within blue wave A. The structure is expected to continue its impulsive trend, with a Wave Cancel invalid level serving as a key point for determining if the current analysis remains valid.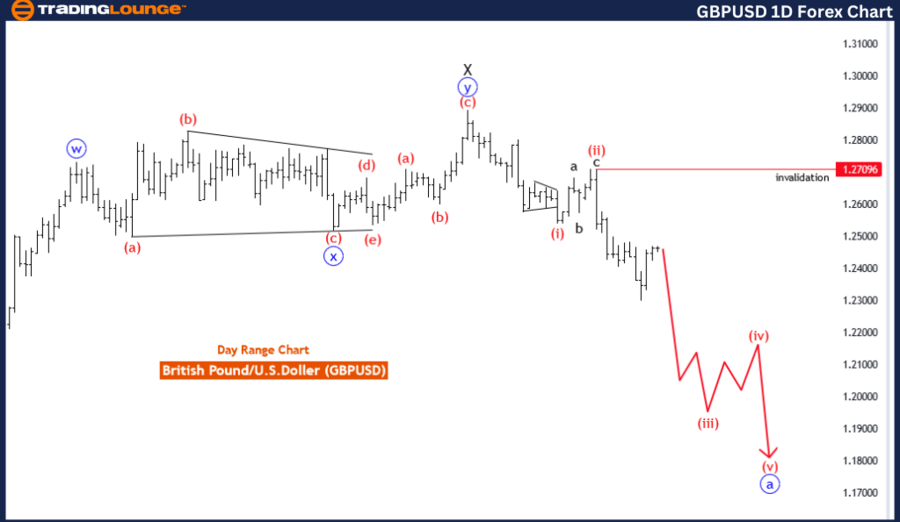 GBPUSD Elliott Wave Analysis Trading Lounge 4 Hour Chart, British Pound/U.S.Dollar(GBPUSD) 4 Hour Chart GBPUSD Elliott Wave Technical AnalysisFUNCTION: Trend MODE: corrective STRUCTURE: black wave 2 POSITION: red wave 3 DIRECTION NEXT LOWER DEGREES: black wave 3 DETAILS: black wave of 2 is in play and likely to end between fib level 50.00 to 61.80 . Wave Cancel invalid level: 1.27096 The GBP/USD Elliott Wave Analysis on the 4-Hour Chart provides insights into the British Pound versus the U.S. Dollar within the framework of Elliott Wave Theory. This analysis helps traders understand the underlying wave structure and anticipate potential market movements.FunctionThe function of this analysis is identified as “Trend,” indicating that the overall market movement aligns with a broader trend. In this case, the trend reflects a continuation pattern where market waves are forming in a way that aligns with the primary direction of the trend.ModeThe mode is labeled as “corrective,” suggesting that the current wave structure represents a correction within a larger trend. Corrective modes typically signify a temporary pullback or consolidation, indicating that the price is currently in a counter-trend phase.StructureThe structure in this analysis is specified as “black wave 2,” which represents an intermediate-level correction. This wave generally appears within a larger trend to correct an earlier impulsive movement, signaling a potential retracement before the larger trend resumes.PositionThe position in the wave pattern is “red wave 3,” indicating that the corrective structure is situated within a broader Elliott Wave framework. Red wave 3 represents a key point in the corrective phase, suggesting an ongoing retracement that could lead to a shift in trend direction.Direction for the Next Lower DegreesThe expected direction for the next lower degrees is indicated as “black wave 3.” This suggests that once the correction completes, the wave pattern will likely transition to a more impulsive phase, potentially indicating a continuation of the broader trend.DetailsThe analysis details that black wave 2 is currently in play and is expected to conclude between the 50.00 and 61.80 Fibonacci retracement levels. This range often indicates a common end for corrective waves, signifying a potential turning point in the trend. The Wave Cancel invalid level is set at 1.27096, suggesting that if the price crosses this point, the current wave structure is invalidated, requiring a re-evaluation of the Elliott Wave count.In summary, the GBP/USD Elliott Wave Analysis on the 4-Hour Chart describes a trend with a corrective mode, indicating that black wave 2 is nearing completion, with a potential transition to a more impulsive black wave 3. The end of this correction between the 50.00 and 61.80 Fibonacci levels might suggest the resumption of the primary trend, with a critical invalidation point to consider for risk management.Technical Analyst : Malik Awais
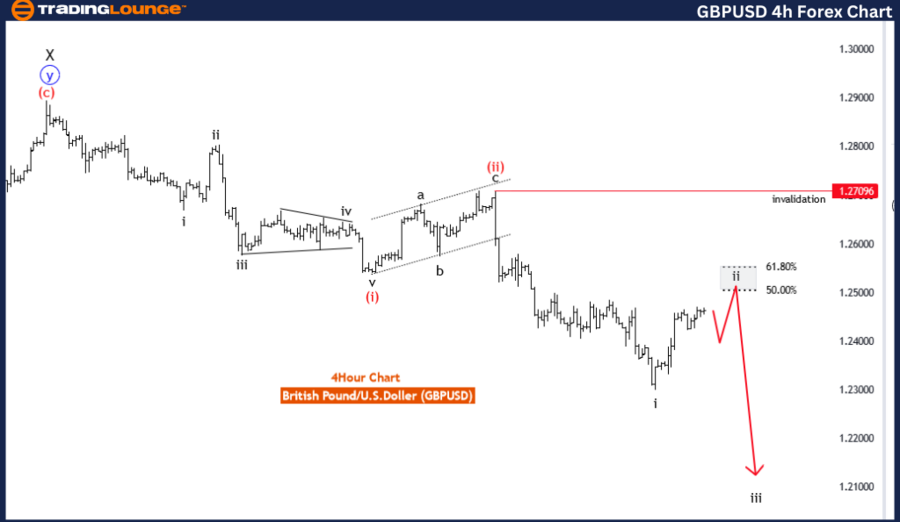 More By This Author:CBA Stock Analysis & Elliott Wave Technical Forecast
Cardano Crypto Price News Today Elliott Wave Technical Analysis
Market Analysis: Exploring Future Trends With Elliott Wave In Leading Indices