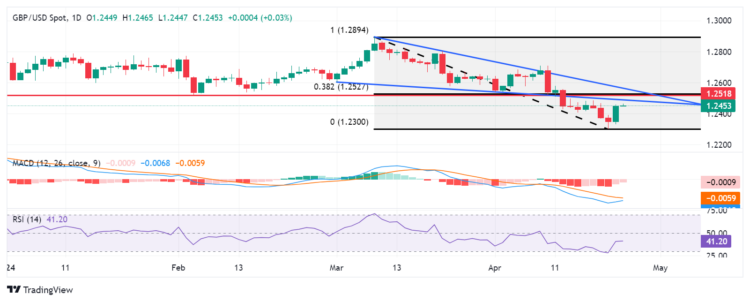
GBP/USD has been on the rise for the second consecutive day, trading around 1.2450 in Asian trading on Wednesday. However, the pair is still below the pullback resistance at 1.2518, which coincides with the lower boundary of the descending triangle at 1.2510. Furthermore, the 14-day Relative Strength Index (RSI) is below the 50 level, indicating a bearish sentiment.Additionally, the Moving Average Convergence Divergence (MACD) confirms this bearish trend, with the MACD line below the centerline and the signal line. Looking ahead, GBP/USD could encounter significant support around the psychological level of 1.2400. If this level is breached, the pair may test the five-month low of 1.2300.On the upside, breaching the descending triangle around the level of 1.2490, along with surpassing the psychological level of 1.2500, could potentially weaken the bearish sentiment. Further resistance is anticipated around the pullback resistance level at 1.2518 and the 38.2% Fibonacci retracement level at 1.2527, drawn between 1.2894 and 1.2300.A breakthrough above the latter resistance region might signify a shift towards a bullish sentiment. In such a scenario, GBP/USD could aim to test the upper boundary of the descending triangle around 1.2565. GBP/USD: Daily Chart 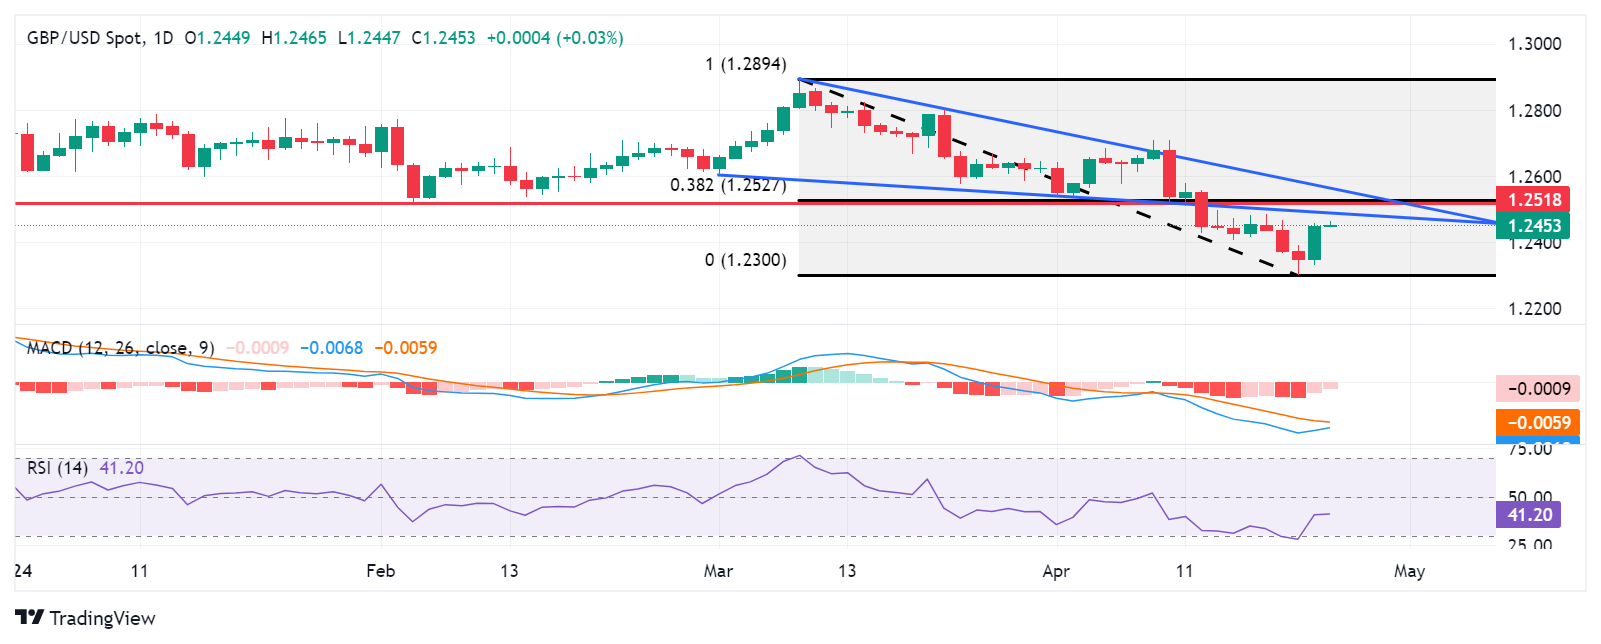 GBP/USD
More By This Author:EUR/USD Price Analysis: Tests The Major Level Of 1.0650; Followed By The Nine-Day EMA
USD/JPY Holds Ground As Iran Plans No Immediate Retaliation Against The Israeli Airstrikes
Gold Price Forecast: XAU/USD Rises Above $2,410 After Reports Of Israeli Attack On Iran