Last week saw both gold and silver close lower as investors finally responded to the recent strength of the US dollar and reduced Fed rate cut bets amid hot inflation data. This week, we will have plenty of US macro highlights to look forward to, which could impact at least the short-term trajectory of precious metals. But with the metals largely ignoring the strength in US Dollar Index and bond yields for much of this year, could we start to see the next phase of the rally commence this week, following the recent consolidation/small pullback in prices? Gold and silver remain in dip-buying modeWhile a more substantial correction remains a possibility, both metals remain in demand, particularly gold. This is essentially because of years of high inflation chipping away at the value of fiat currencies, which is the same reason why Bitcoin has also been hitting record levels, before its recent consolidation phase.With many investors who missed out on the recent surge in gold and silver prices, they are now monitoring for chances to purchase during price dips. Advocates for precious metals emphasise their recent resilience in the face of a strong dollar and rising bond yields. They contend that with prices no longer excessively inflated, the upward trajectory could continue, especially considering the metals’ underlying factors like ongoing central bank acquisitions of gold and the role of precious metals as an inflation hedge. Following years excessive inflation, fiat currencies have significantly depreciated, prompting investors to view precious metals as a dependable safeguard against inflation.On the other hand, the bears argue that elevated yields and diminished expectations for Federal Reserve interest rate cuts in 2024 are likely to bolster the dollar, exerting downward pressure on gold and silver, as well as other metals denominated in dollars. Nevertheless, this scenario has yet to materialise so far in 2024, which must be – as it so far has been – a bullish sign. Gold technical analysis 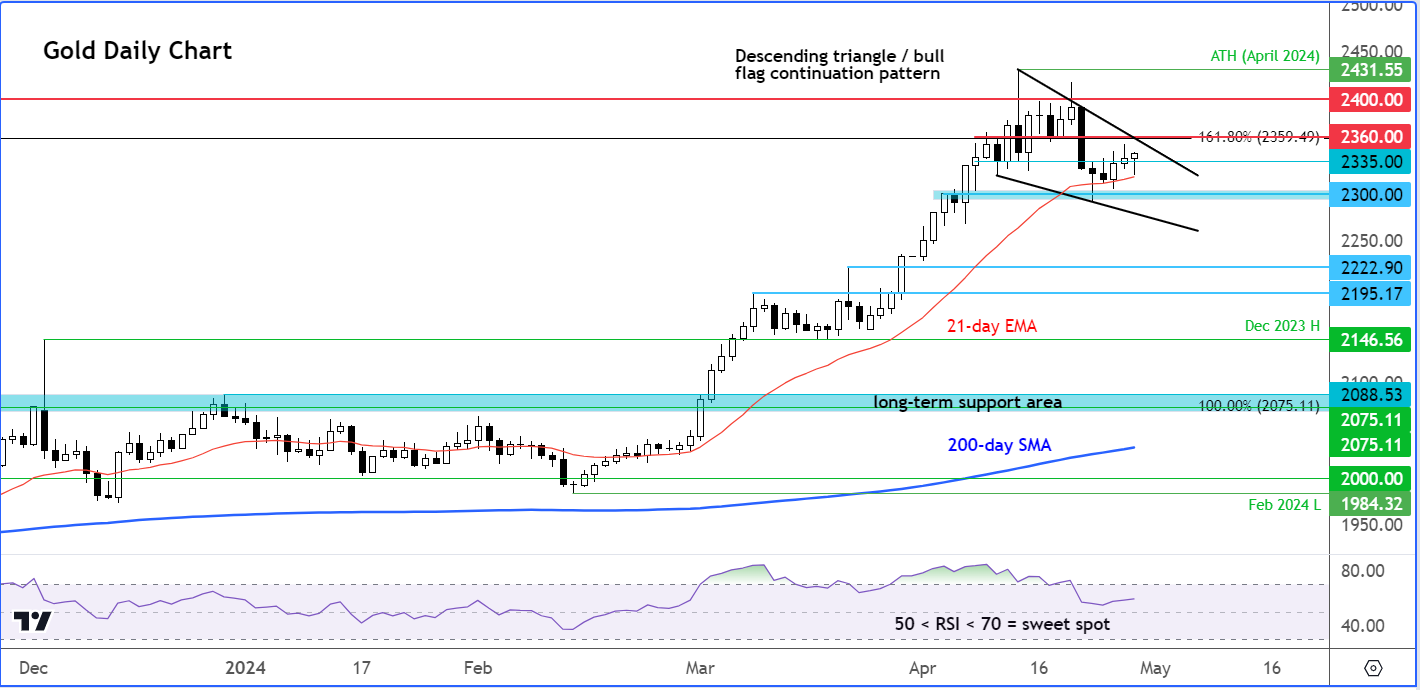 In the last few days, we have seen the gold chart starting to show some signs of bullishness again. It has so far held above the technically-important 21-day exponential moving average on a daily closing basis, finding good support from the $2300 levels. So far, we haven’t seen a decisive move higher, but do watch out for further bullish signals to emerge around these levels. Even if we don’t see a decisive move higher this week, an alternative sign of strength would be if we see prices continue to consolidate inside a bullish continuation pattern like a bull flag or a descending triangle. In terms of levels to watch, support-term support comes in around $2330/5, followed by $2300. However, if gold were to break below $2300, then the bulls will need to wait for a confirmed reversal signal as that would point to a loss of bullish momentum. Even so, there will be lots of further support levels to watch should prices stage a deeper retracement. The next significant support level comes in around the $2222 area.On the upside, $2360 is the next level of potential resistance, where the resistance trend of the triangle pattern and the long-term 161.8% Fibonacci extension level (derived from the 2020-2022 downswing) converge. Above this threshold, $2400 presents as the subsequent potential resistance, potentially impeding the path toward surpassing this month’s peak of $2431 and establishing a new all-time high for the gold price. Silver trying to form base around $27Silver’s rally that was also fuelled by a technical breakout above key resistance in the $25/$26 area, came to a halt in the last week and a bit. Both silver and gold had reached overbought levels, so it was hardly surprising to see the metals retreat somewhat from their recent highs. That said, the big breakout in silver after a multi-year consolidation means traders will be happy to buy the dips.
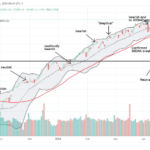
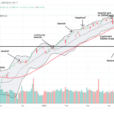
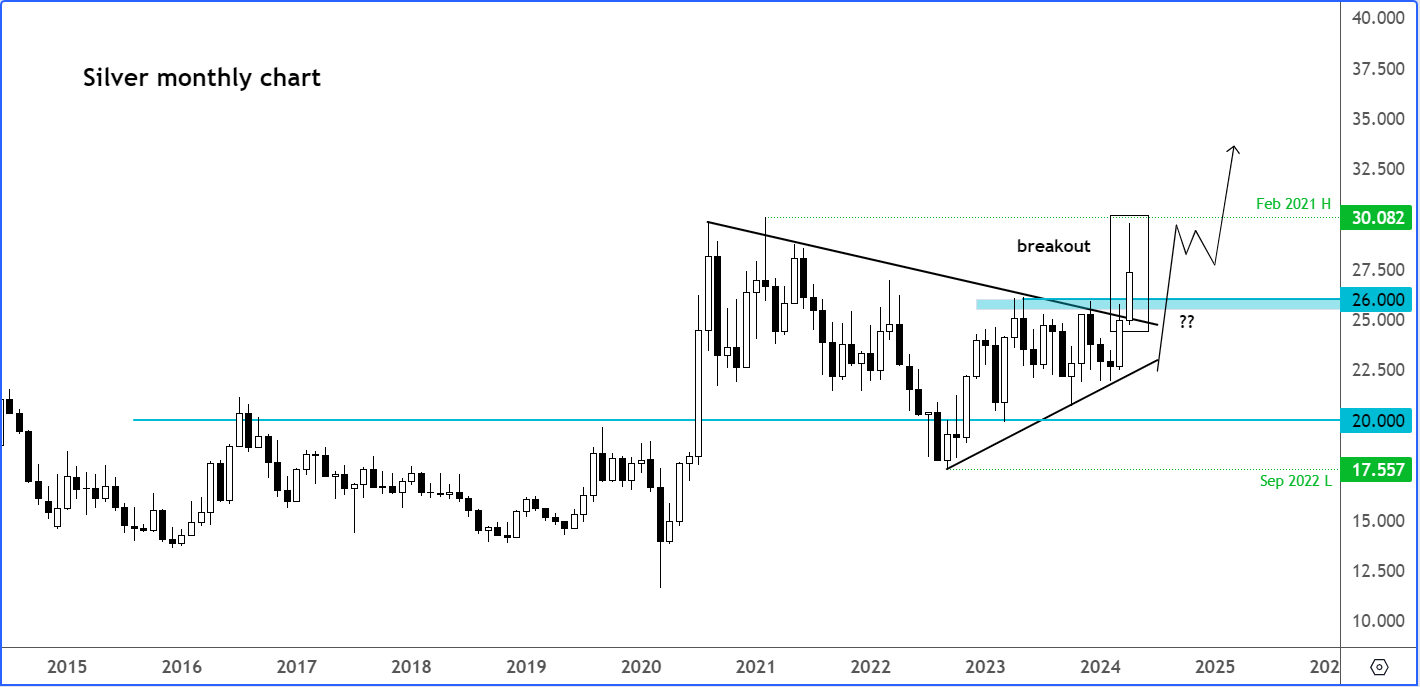 So, I am expecting to see more gains for silver this year, particularly because the grey metal has not even neared the highs of its most recent years around $30, let alone its record peak of near $50 that it had hit in 2011. In contrast gold has been hitting repeated all-time highs, until easing back in the last couple of weeks. Thus, silver has a lot of catching up to do on the upside, and the recent technical breakout from a 3.5-year consolidation phase may well be the start of a long bull market.
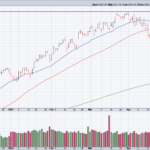
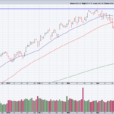
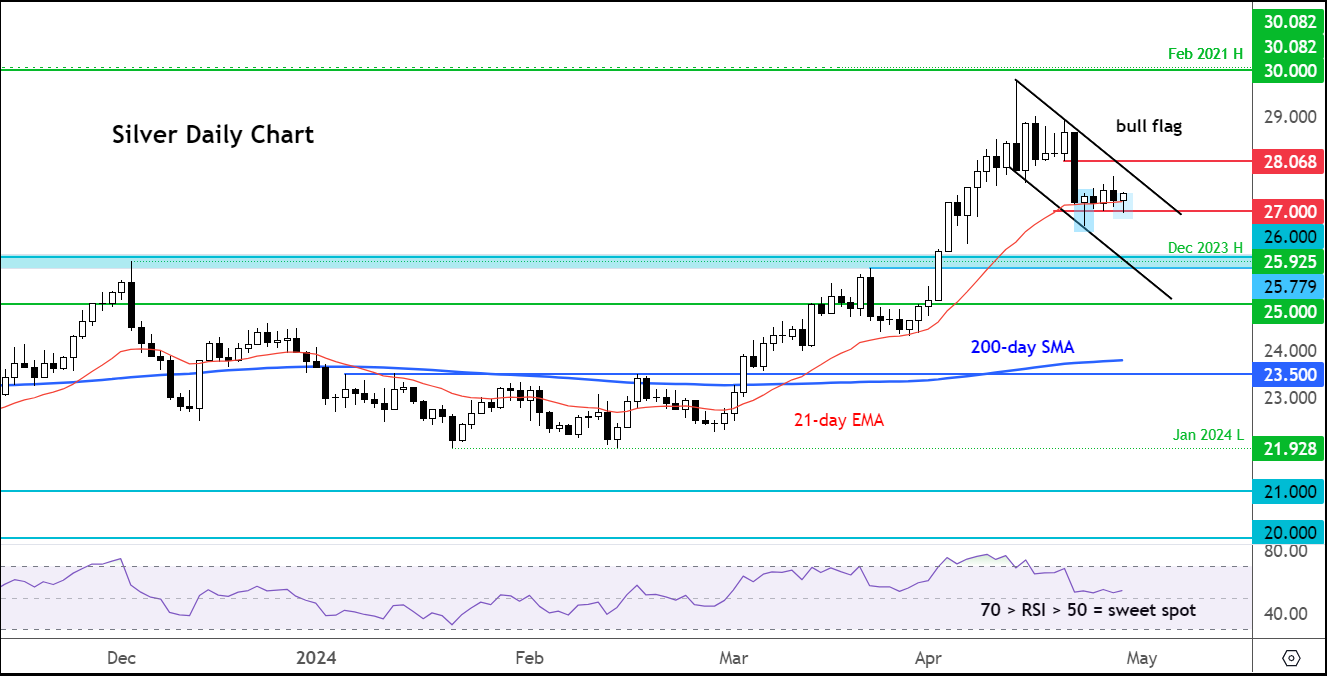 While an ideal long entry area could be on a potential dip back to the $25-$26 area, which was the base of this month’s breakout, an alternative approach would be to see if silver can consolidate inside a bullish continuation pattern around current levels, and then look to potentially buy once it breaks higher or about to break higher. On the daily time frame, we have seen silver forming a few interesting-looking candles in the last few trading sessions, including a couple of hammers off support and 21-day exponential moving average around the $27 area. So, perhaps the metal could launch higher from around the $27 support area, although it is a bit early to tell as prices consolidate inside what looks like a bullish flag pattern.In any case, silver remains in a dip-buying mode as undoubtedly many people have missed this big up move and will be looking to get onboard when the opportunity arises. The good news is that the Relative Strength Index (RSI) has worked off its extremely overbought conditions and now it is in the sweet spot of just above 50.0.More By This Author:Gold Eyes Bullish Trend Resumption As Traders Await Key US Data Currency Pair Of The Week: USD/JPY – Tuesday, April 23Nasdaq In Focus As Netflix Kick Starts Big Tech Earnings