Soybeans Elliott Wave Analysis
Function – Trend
Mode – Impulse
Structure – Impulse for (5)
Position – Wave 2 of (5)
Direction – Wave 3 of (5)
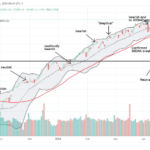
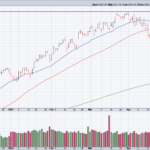
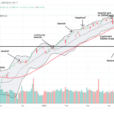
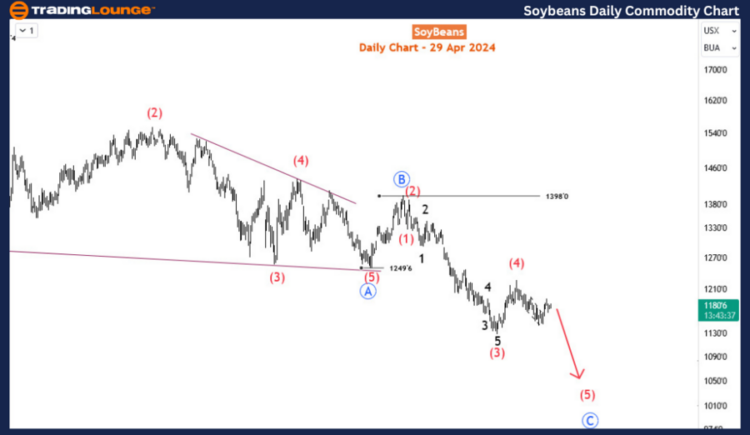
Details – Wave 2 of (5) may have been completed and the price is currently in 3. A break below 1144 will confirm further provided the current rally does not develop above 1226. Not much has changed since the last update.In the intricate dance of market movements, April has presented a mixed picture for Soybean prices. The month witnesses an intriguing unwinding of gains accrued in the first half, juxtaposed against a downward trajectory in the latter part. This shift in momentum comes amidst a broader context where, following a recovery phase throughout much of March, Soybean finds itself relinquishing those hard-won gains. The commodity now stands at the precipice, its gaze fixed on breaching key support levels as it appears poised to extend the bearish sequence initiated back in June 2022.Delving into the daily chart, a compelling narrative emerges. Since June 2022, Soybean has been entrenched in a formidable bearish cycle, commencing at $1785. Over this period, prices have experienced a relentless descent, shedding over 34% along the way. Yet, within this downward spiral lies a deeper story—a correction unfolding against the backdrop of a prior bullish impulse rally that spanned from May 2019 to June 2022. This correction, while tempering short-term optimism, holds the promise of paving the way for a resumption of the long-term bullish trend once its corrective phase reaches its denouement. Nevertheless, the path ahead remains veiled in uncertainty, with the prospect of continued downside correction lingering for several weeks. Through the lens of Elliott wave theory, this corrective cycle manifests as a zigzag pattern denoted by waves A-B-C (circled in blue) of the primary degree, with the current descent representing wave (5) of blue wave C.Zooming in on the H4 chart, a microcosm of price action unfolds. Here, wave (4) finds its terminus at 1226, heralding the inception of wave (5). The initial salvo of wave 1 of (5) culminates in a diagonal pattern at 1140 in April 2024, preceding the current phase of corrective rebound encapsulated within wave 2. Confirmation of wave 2’s conclusion hinges upon the breach of the 1140 threshold, signifying the onset of wave 3. Yet, this anticipated trajectory stands vulnerable to disruption should the ongoing rally breach the high of wave (4) at 1226, thereby invalidating the current wave count. Thus, as Soybean charts its course amid the ebb and flow of market dynamics, the intricacies of Elliott wave analysis offer a lens through which to decipher its unfolding journey. 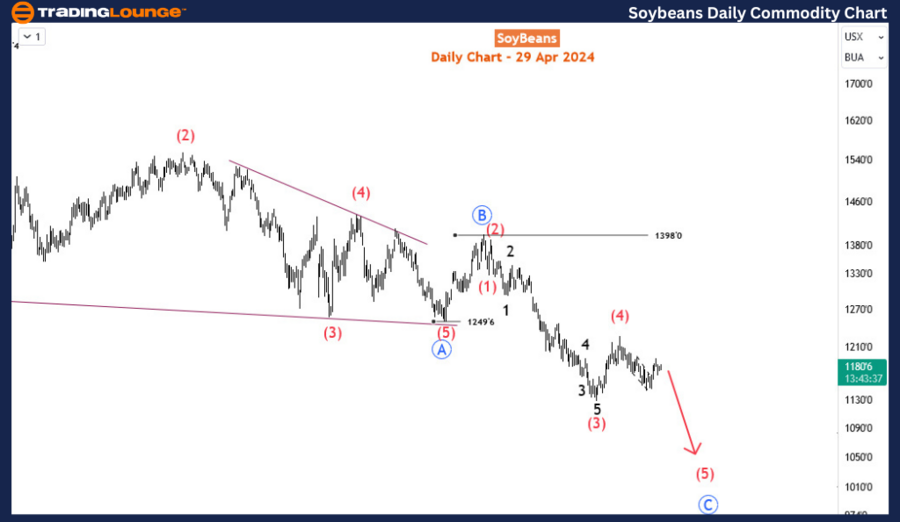
 More By This Author:Binance Crypto Price News Today; Elliott Wave Technical Analysis
Elliott Wave Analysis: Nasdaq Stocks, AAPL, AMZN, NVDA, META, NFLX, GOOGL, MSFT, TSLA.
Elliott Wave Technical Analysis: Microsoft Inc. – Friday, April 26