One way to gauge the well-being of stock assets is to examine all of the 1900-plus stocks listed on the New York Stock Exchange. We can do this by evaluating the progress of the NYSE Composite Index.
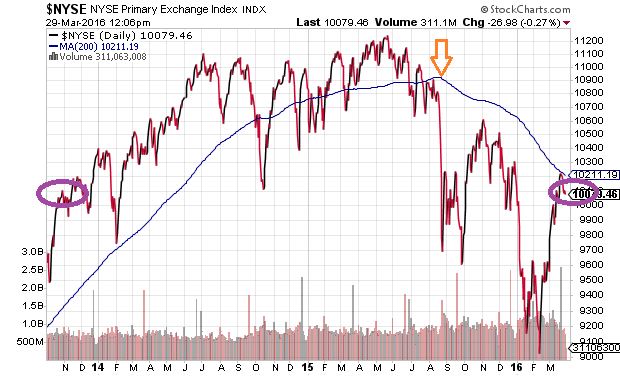
The first item worth noting is that stock assets have struggled to make any progress since late October of 2013 – the index has failed to maintain any price appreciation in nearly two-and-a-half years. The second observation? The NYSE Composite peaked at about the same time as the Dow Jones Industrials (DJI) and S&P 500. It follows that the bull market may have ended on May 21, 2015. Indeed, it has been more than 10 months since a wide range of stocks collectively hit record highs.
The third item worthy of discussion is the reality that the slope of the NYSE’s 200-day moving average has been negative since August of 2015. The turning point represents a technical shift from uptrend to downtrend. Moreover, until a new uptrend materializes, price volatility is likely to remain and stock gains are unlikely to last.
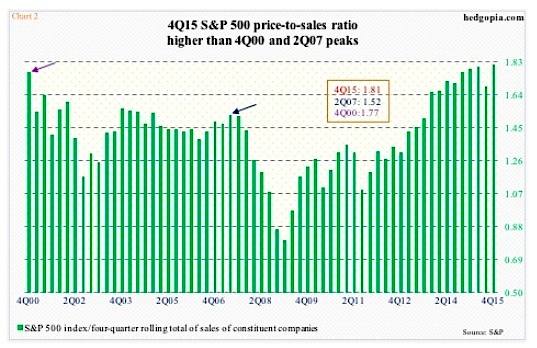
Price movement alone is not the only headwind for stocks. Extreme valuations present a challenge as well. For example, the price-to-sales (P/S) for the S&P 500 by Q4 2015 had approached 1.8. Stocks prices relative to corporate revenue were not this high before the financial collapse. The only other time that stock prices relative to sales at public corporations were this lofty? 2000 – right before the dot-com collapse.
In truth, it does not matter which method of traditional stock valuation that one employs. Price-to-earnings – forward, current, and cyclically-adjusted P/E 10 – all place stocks at the higher end of exorbitant. Market-cap-to-GDP or market-cap-to-GNP both demonstrate that stocks are pricier than the 2007 top and only surpassed by the the 2000 New Economy insanity. (See chart below.) What’s more, the tiresome low interest rate argument that supposedly makes stocks “the only game in town,” has been debunked by similar periods of ultra-low rates (i.e., 1936-1955) as well as the ongoing demand for safe haven assets throughout the current Feb-March rally.