Curve watchers anonymous has taken an in-depth review of US treasury yield charts on a monthly and daily basis. There’s something going on that we have not see on a sustained basis since the summer of 2000. Some charts will show what I mean.
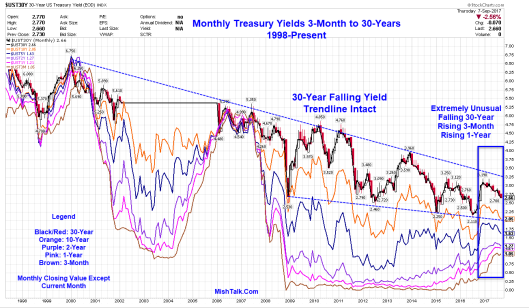
Monthly Treasury Yields 3-Month to 30-Years 1998-Present

It’s very unusual to see the yield on the long bond falling for months on end while the yield on 3-month bills and 1-year note rises. It’s difficult to spot the other time that happened because of numerous inversions. A look at the yield curve for Treasuries 3-month to 5-years will make the unusual activity easier to spot.
Monthly Treasury Yields 3-Month to 5-Years 1990-Present

Daily Treasury Yields 3-Month to 5-Years 2016-2017

Daily Treasury Yields 3-Month to 5-Years 2000

One cannot blame this activity on hurricanes or a possible government shutdown. The timeline dates to December of 2016 or March of 2017 depending on how one draws the lines.
This action is not at all indicative of an economy that is strengthening.
Rather, this action is indicative of a market that acts as if the Fed is hiking smack in the face of a pending recession.
Hurricanes could be icing on the cake and will provide a convenient excuse for the Fed and Trump if a recession hits.
Related Articles