Archives by Month:
- May 2024
- April 2024
- March 2024
- January 2024
- December 2023
- November 2023
- October 2023
- August 2023
- July 2023
- June 2023
- May 2023
- February 2023
- January 2023
- December 2022
- November 2022
- October 2022
- September 2022
- August 2022
- July 2022
- June 2022
- May 2022
- April 2022
- March 2022
- February 2022
- January 2022
- December 2021
- November 2021
- October 2021
- September 2021
- August 2021
- July 2021
- June 2021
- May 2021
- April 2021
- March 2021
- February 2021
- January 2021
- December 2020
- November 2020
- October 2020
- September 2020
- August 2020
- July 2020
- June 2020
- May 2020
- April 2020
- March 2020
- February 2020
- January 2020
- December 2019
- December 2018
- November 2018
- October 2018
- September 2018
- August 2018
- July 2018
- June 2018
- May 2018
- April 2018
- March 2018
- February 2018
- January 2018
- December 2017
- November 2017
- October 2017
- September 2017
- August 2017
- July 2017
- June 2017
- May 2017
- April 2017
- March 2017
- February 2017
- January 2017
- December 2016
- November 2016
- October 2016
- September 2016
- July 2016
- June 2016
- April 2016
- March 2016
- February 2016
- January 2016
- December 2015
- November 2015
- October 2015
- September 2015
- August 2015
- July 2015
- June 2015
- May 2015
- April 2015
- March 2015
- February 2015
- January 2015
- December 2014
- November 2014
- October 2014
- September 2014
- August 2014
- July 2014
- June 2014
- May 2014
- April 2014
- March 2014
- February 2014
- January 2014
- December 2013
- November 2013
- October 2013
- September 2013
- August 2013
- July 2013
- June 2013
- May 2013
- April 2013
- March 2013
- February 2013
- January 2013
- November 2012
- October 2012
- August 2012
- July 2012
- June 2012
- May 2012
- April 2012
- March 2012
- February 2012
- January 2012
- December 2011
- November 2011
- October 2011
- September 2011
- August 2011
- July 2011
- June 2011
- May 2011
- April 2011
- March 2011
- February 2011
- January 2011
- December 2010
- November 2010
- October 2010
- September 2010
- August 2010
- July 2010
- June 2010
- May 2010
- April 2010
- March 2010
- February 2010
- January 2010
- December 2009
- November 2009
- October 2009
- September 2009
- August 2009
- June 2009
- April 2009
- February 2009
- December 2008
- November 2008
- October 2008
- August 2008
- June 2008
- May 2008
Archives by Year:

SPX Could Retrace Two-Year Rally
VIX pulled back from a test of its March 2 high at 26.22 a week ago, closing above Short-term support at 18.83. The next probe higher may exceed the prior high in the next 1-2 weeks. (Bloomberg) The prime suspects in last month’s global rout may be at it again. Inverse exchange-traded funds — which […]
Quick Take: GDP Linked Bonds?
There is a core concept in finance that states that an investor should be properly compensated for the amount of risk taken. While central banks have certainly distorted the amount of compensation per degree of risk, the axiom still holds true. It is in this light that we recently read an article entitled GDP-linked bonds could […]
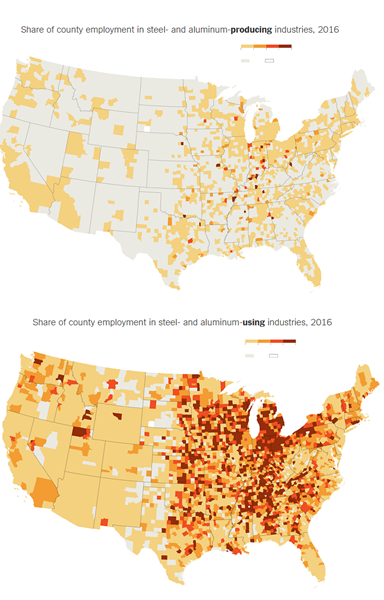
The Simple Reason Why Steel Tariffs Will Destroy More Jobs Than They Create
The US maps below show: a) the share of each US county’s employment in steel- and aluminum-producing industries in 2016 (top map) and b) the share of each US county’s employment in steel- and aluminum-using industries (bottom map). The maps were featured in a recent New York Times article titled “How Trump’s Protectionism Could Backfire.” Here’s a slice: Tupelo […]
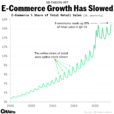
Have Investors Priced In Veeva Systems Inc’s Growth?
Veeva Systems Inc. (NYSE: VEEV), a healthcare firm with a market capitalization of $10.3 billion, saw its share price increase by 30.7% over the prior three months. As a large-cap stock with high coverage by analysts, you could assume any recent changes in the company’s outlook is already priced into the stock. Is there still an […]
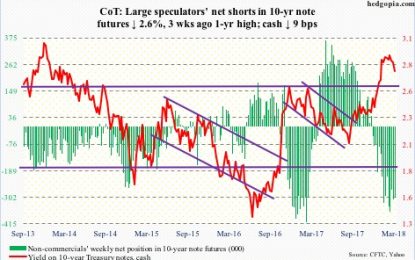
Peeking Into Future Through Futures, And How Hedge Funds Are Positioned, Via CoT
Following futures positions of non-commercials are as of March 27, 2018. 10-year note: Currently net short 305.2k, down 8.1k. For the first time since mid-December last year, 10-year Treasury yields went under the 50-day moving average this week. On March 21 – the day the FOMC concluded its two-day meeting by raising the fed funds […]
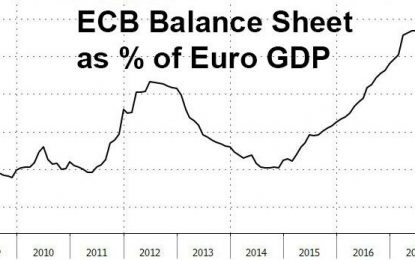
ECB Doubles Bond Purchases Just As Market Hits Turbulence
We find it amusing how much digital ink continues to be spilled to predict i) when the ECB will end its QE and ii) whether it will hike before or after it finally stops purchasing government and corporate bonds, or funnier yet, start selling them. The reason for that is that over the past 4 […]
S&P 500 Ends Quarter Down 1.22%
Streak Of 9 Positive Quarters Is Snapped There were many record winning streaks snapped by the correction in February. With the weakness in March combined with the February decline, the market had its first down quarter since 2015 as the S&P 500 fell 1.22%. The Wall Street phrase “the easy money has been made” is […]

Oil ETFs Take A Hit On Sudden Inventory Build
Oil prices have been erasing the gains from last week, as weekly U.S. shale production witnessed a sharp increase. Moreover, weakness in the financial markets owing to trade fears and the tech sector’s headwinds are exerting pressure on oil prices as investors became more risk averse. OPEC’s fears came true. Amid the rally in crude […]
Best And Worst Forex And Commodity Performers In April (Seasonality)
Here are the currencies and commodities that do well or poorly in April, historically. Statistics include how often the prices rise or fall, and by how much, on average. Forex Seasonality For April The US Dollar Index (DX) has fallen in 14 of the last 20 years (70%), dropping an average of 0.8% in April. The PowerShares US […]
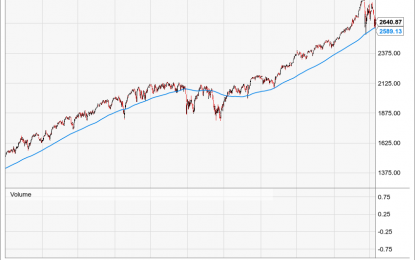
The S&P’s 200-DMA: Why It Ain’t No Maginot Line
For the last five years the S&P 500 has been dancing up its ascending 200-day moving average (200-DMA), bouncing higher repeatedly whenever the dip-buyers did their thing. Only twice did the index actually break below this seeming Maginot Line: In August 2015, after the China stock crash, and in February 2016, when the shale patch/energy sector hit the wall. […]