 Image Source: Pixabay
The first red flags emerged in the summer of 2022: that’s when the Biden Labor Department started well and truly rigging the labor market data.Regular readers may recall that it was back in July of 2022, when we first warned them that something had snapped in the labor market: that’s when a staggering discrepancy emerged between the number of Payrolls (as measured by the BLS’ Establishment Survey, a far more crude and imprecise, yet much more market-moving data series), and the number of actual Employed Workers (as measured by the BLS’ far more accurate Household Survey). As we showed at the time, after the two series had tracked each other tick for tick, a gap opened in March 2022 which quickly grew to 1.5 million jobs in just 3 months…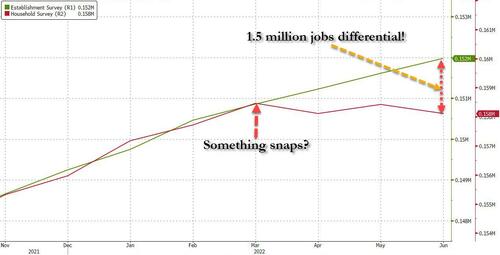 … and has since exploded to a whopping gap of 5 million “jobs” that apparently do not exist.
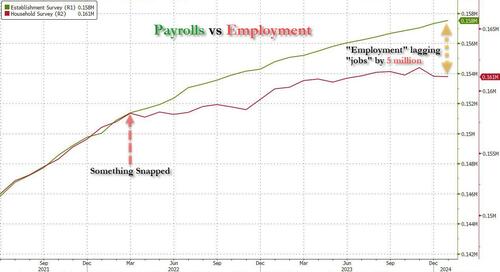 And while some of this discrepancy could be explained with the record surge in multiple jobholders, which increased by 1 million since March 2022 to an all time high of 8.6 million at the end of 2023 (as a reminder, the Establishment Survey counts 1 worker have 2 or 3 (or more) multiple jobs as, well, 2 or 3 (or more) separate jobs, even if it is just one worker trying to make ends meet under the roaring inflation of Bidenomics), most of the gap remained unexplained.There was more: it was around the summer of 2022 that the Biden labor department – in its zeal to show job growth no matter the cost, or quality of jobs – also started fooling around with the composition of the labor market, with most of the monthly gains going to part-time workers, even as full-time workers stagnated or declined. The culmination, as we reported earlier this month, is that in February 2024, the US had 132.9 million full-time jobs and 27.9 million part-time jobs. Which is great… until you look back one year and find that in February 2023 the US had 133.2 million full-time jobs, or more than it does one year later! And yes, all the job growth since then has been in part-time jobs, which have increased by 921K since February 2023 (from 27.020 million to 27.941 million).
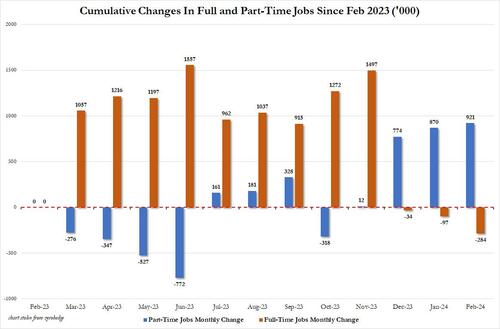 In other words, starting in 2022 and accelerating to present days, less and less full-time jobs were added, until we got to the absurd situation that all the new jobs in the past year have been part-time jobs!
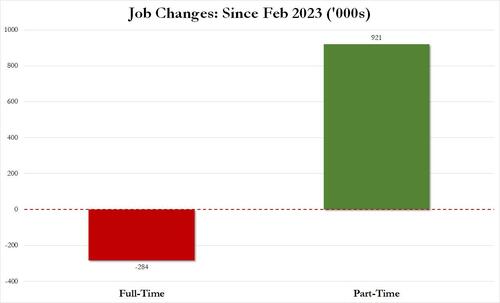 And then there was, of course, the great jobs replacement theory, only as we first showed well over a year ago, it wasn’t a theory but practice, and following countless months in which native-born workers lost their jobs, including a near-record 3-month plunge to start 2024…
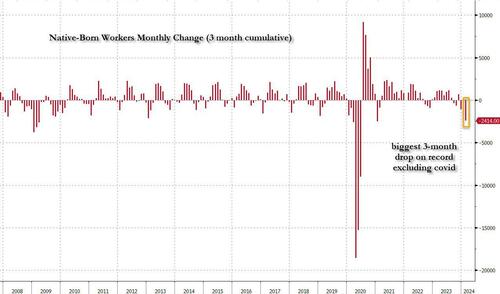 … offset by a record 1.2 million foreign-born (read immigrants, both legal and illegal but mostly illegal) workers added in February…
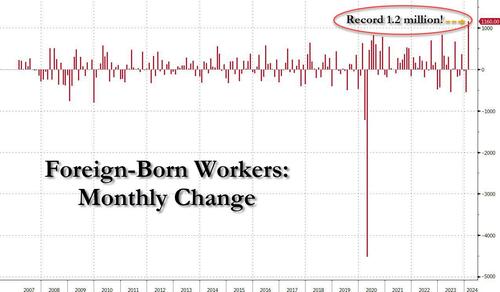 Or, as we first pointed out several months ago, not only has all job creation in the past 6 years – since May 2018 – has been exclusively for foreign-born workers…
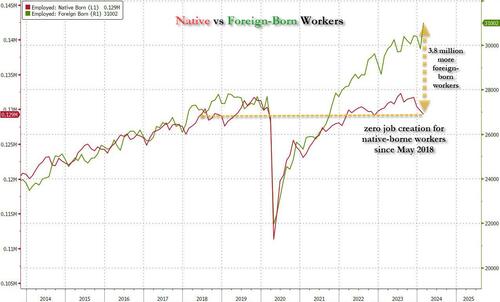 … but there has been zero job-creation for native born workers since June 2018!
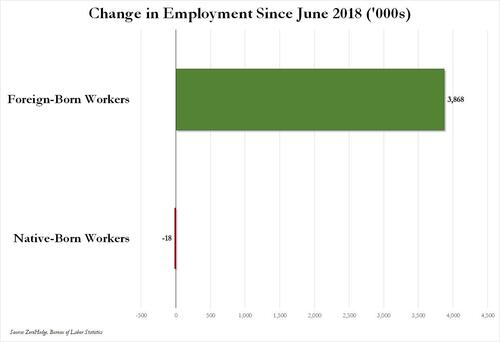 Ok fine, but all of the above are really just example of the Biden admin Labor Department playing around with statistics and trying (and succeeding) to fool the greatest number of people. There is really nothing about outright data rigging and fabrication… and also while we realize that the Household survey shows a far uglier labor market – one where part-time jobs, illegal immigrants, and multiple jobholders dominate – what about the Establishment survey, which is behind the actual payrolls number, the only number that matters as far as the market is concerned?All good points, and to address them, we first have to go back to December 2022, when we reported something shocking: as part of its data analysis of the “more comprehensive, accurate job estimates released by the BLS as part of its Quarterly Census of Employment and Wages (QCEW) program“, the Philadelphia Fed found that the BLS had overstated jobs to the tune of 1.1 million! This is what the Philadelphia Fed wrote in its quarterly Early Benchmark Revision of State Payroll Employment report at the time:
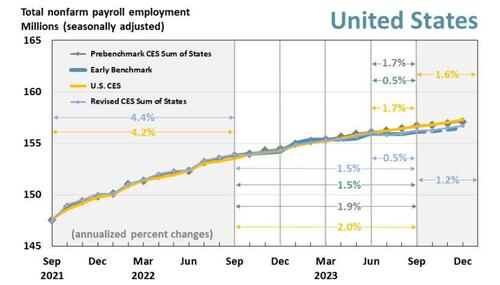
Our estimates incorporate more comprehensive, accurate job estimates released by the BLS as part of its Quarterly Census of Employment and Wages (QCEW) program to augment the sample data from the BLS’s CES that are issued monthly on a timely basis. All percentage change calculations are expressed as annualized rates. Read more about our methodology. Learn more about interpreting our early benchmark estimates.
So what did this “more accurate”, “more comprehensive” report find? It found that…
In the aggregate, 10,500 net new jobs were added during the period rather than the 1,121,500 jobs estimated by the sum of the states; the U.S. CES estimated net growth of 1,047,000 jobs for the period.
This is shown graphically in the chart below: specifically, the analysis looks at the quarter in the red box, where the green line, or the more accurate “early benchmark” revision of official data, dipped decidedly below the CES trendline (i.e., the nonfarm payrolls).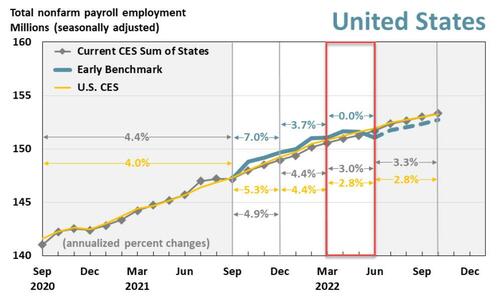 Alas, since the far more accurate Quarterly Census of Employment and Wages (QCEW) numbers would not be actually incorporated into BLS benchmarks for well over a year after we wrote our analysis in Dec 2022, neither we nor the market would know just how manipulated the data was until early 2024. Which, of course, is now, and as we already know, the BLS had been consistently downward revising virtually all initial job prints in 2023 (ten of the eleven jobs reports heading into Dec 2023 were revised lower) to make the economy more realistic but only in retrospect…
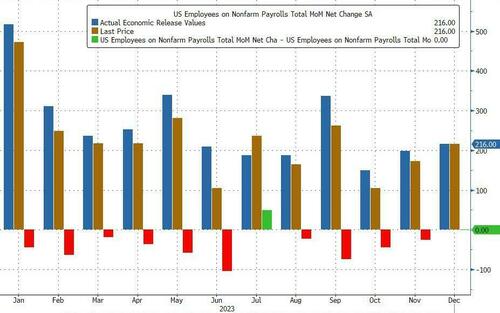 … however, even though we do know now that the jobs data in 2022 was far weaker than anyone thought at the time, nobody really cares: after all there are part-time jobs and illegal immigrants to plug any and all historical holes, plus we are talking about ancient history.Plus, we have all those great recent jobs reports to fall back on: the ones that confirm that Bidenomics is doing such a great job.Only… that’s not true either. Presenting Exhibit A: the latest Philadelphia Fed quarterly report on Early Benchmark Revisions of State Payroll Employment. It shows that once again, the BLS has been fabricating jobs, and not just any jobs but those that make up the all-important (if highly inaccurate) payrolls reported by the Biden Bureau of Goalseeked Statistics.The primary purpose of this analysis, in the Philly Fed’s own words, is “to produce timely estimates of state payroll jobs that closely predict the annual benchmark revisions released by the BLS each March. To do so, we incorporate more comprehensive job estimates released by the BLS as part of its Quarterly Census of Employment and Wages (QCEW) program.” This is more or less a replica of the analysis which the Philly Fed performed back in December, when it found that 1.1 million jobs were unexpectedly “missing.”So what happened this time? Well, the analysis, which looked at state-level data, “found that “the employment changes from June through September 2023 were significantly different in 27 states compared with prebenchmark state estimates from the Bureau of Labor Statistics’ (BLS) Current Employment Statistics (CES).” Specifically, “early benchmark (EB) estimates indicated lower changes in 24 states, higher changes in three states, and lesser changes in the remaining 23 states and the District of Columbia.“Some more details from the report:
Over the full year ending with this 2023 Q3 vintage — which includes additional QCEW data changes affecting the prior three quarters — payroll jobs in the 50 states and the District of Columbia grew 1.5 percent.
- Based on the pre-benchmark CES sum of states and the U.S. CES, payroll jobs grew 1.9 percent and 2.0 percent, respectively.
- The revised CES sum-of-states growth rate is 1.5 percent.
For 2023 Q3, payroll jobs in the 50 states and the District of Columbia rose 0.5 percent, after adjusting for QCEW data.
- Based on both the prebenchmark CES sum of states and the U.S. CES, payroll jobs grew 1.7 percent.
- The revised CES sum-of-states growth rate is 0.5 percent
 We’ll go back to the chart above in a second, but first we wanted to show this scatter of state-level employment comparing the St Louis Fed’s more accurate early benchmarking process vs the BLS’ Prebenchmarking CES process: it found that most states’ labor data would be revised lower, in many substantially so.
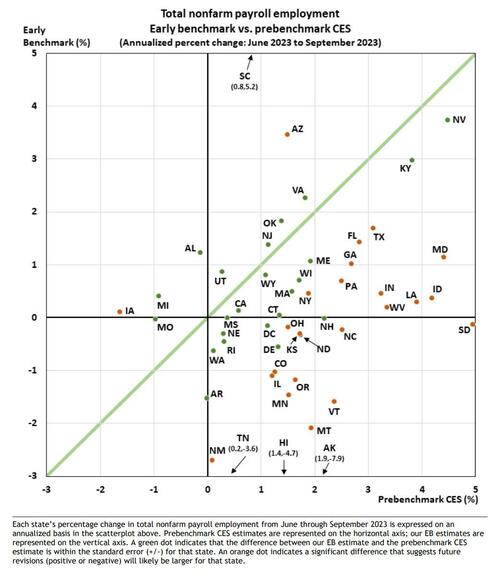 Ok… but what does all of that mean in English?Well, to make some more sense of the data, we went through the Early Benchmark state-level data excel spreadsheet provided by the Philly Fed (link), and simply added across the various states to obtain aggregate, country-level data so that we could compare the far more accurate QCEW data with what the BLS had been peddling for the past year.The result was – again – shocking, and as shown in the chart below, a little over a year after we, or rather the Philly Fed, found that the reported something shocking, here we go again, only this time the BLS had overstated payrolls by 800,000 through Dec 2023 (and more if one were to extend the data series into 2024). It’s truly statistically remarkable how every time the data error is in favor of a stronger, if fake, economy.
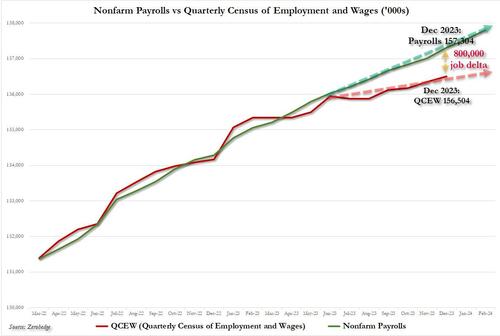 it also means that far from the stellar 230K average monthly increase in payrolls in 2023, which the White House would spin time and again as direct evidence of the benefits of Bidenomics, the true average monthly payroll increase in 2023 was only 130K! The full monthly change in payrolls as originally reported by the BLS (in green) and the actual monthly number, as per the QCEW (in red) is shown below.
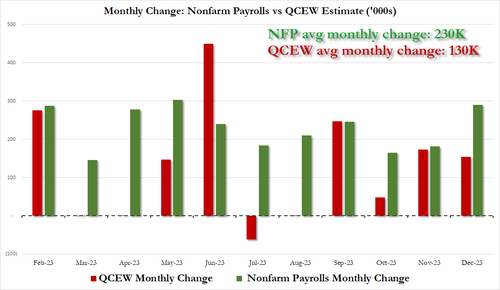 Putting it all together, we now know – as the Philly Fed reported first – that the labor market is far weaker than conventionally believed. In fact, no less than 800,000 payrolls are “missing” when one uses the far more accurate Quarterly Census of Employment and Wages data rather than the BLS’ woefully inaccurate and politically mandated payrolls “data”, and if one looks back the the monthly gains across most of 2023, one gets not 230K jobs added on average every month but rather 130K.Of course, none of that paints Bidenomics in a flattering picture, because while one can at least pretend that issuing $1 trillion in debt every 100 days to add 3 million jos per year is somewhat acceptable, learning that that ridiculous amount buys 800,000 jobs less is hardly the endorsement that the White House needs.Which is also why nobody in the mainstream media – which is now nothing more than the PR smokescreen for the Biden puppetmasters, the government and the deep state – will ever mention this report.As such, we urge all readers to read Philly Fed analysis (link here) and to analyze the excel data (link here) at their own leisure, because in a fascist state, the media no longer works for the people.More By This Author:Pending Home Sales Hover Near Record Lows In February
Stocks Set To Close Blowout Week, Month And Quarter At All-Time High; Gold Soars To Record
Zero Critical Reasoning: Employers Say GenZ Toxic For Companies