The latest Conference Board Consumer Confidence Index was released this morning based on data collected through November 13. The headline number of 135.7 was a decrease from the final reading of 137.9 for October. Today’s number was below the Investing.com consensus of 135.9.
“Despite a small decline in November, Consumer Confidence remains at historically strong levels,” said Lynn Franco, Senior Director of Economic Indicators at The Conference Board. “Consumers’ assessment of current conditions increased slightly, with job growth the main driver of improvement. Expectations, on the other hand, weakened somewhat in November, primarily due to a less optimistic view of future business conditions and personal income prospects. Overall, consumers are still quite confident that economic growth will continue at a solid pace into early 2019. However, if expectations soften further in the coming months, the pace of growth is likely to begin moderating.”
Putting the Latest Number in Context
The chart below is another attempt to evaluate the historical context for this index as a coincident indicator of the economy. Toward this end, we have highlighted recessions and included GDP. The regression through the index data shows the long-term trend and highlights the extreme volatility of this indicator. Statisticians may assign little significance to a regression through this sort of data. But the slope resembles the regression trend for real GDP shown below, and it is a more revealing gauge of relative confidence than the 1985 level of 100 that the Conference Board cites as a point of reference.

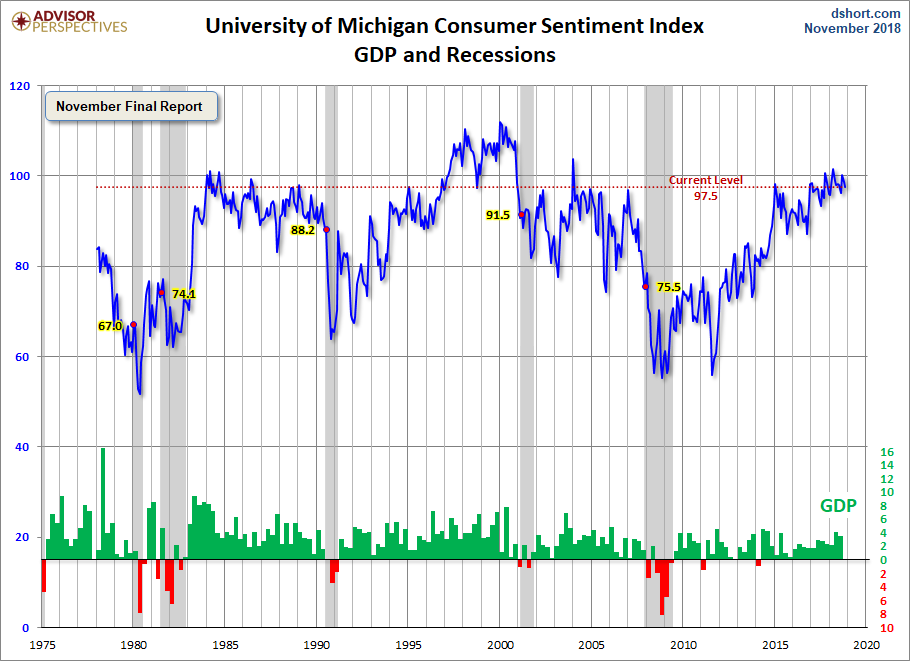
For an additional perspective on consumer attitudes, see the most recent Reuters/University of Michigan Consumer Sentiment Index. Here is the chart from that post.
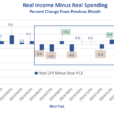
And finally, let’s take a look at the correlation between consumer confidence and small business sentiment, the latter by way of the National Federation of Independent Business (NFIB) Small Business Optimism Index. As the chart illustrates, the two have tracked one another fairly closely since the onset of the Financial Crisis, although a spread appears infrequently, with the most recent spread showing up 2015 through 2017.